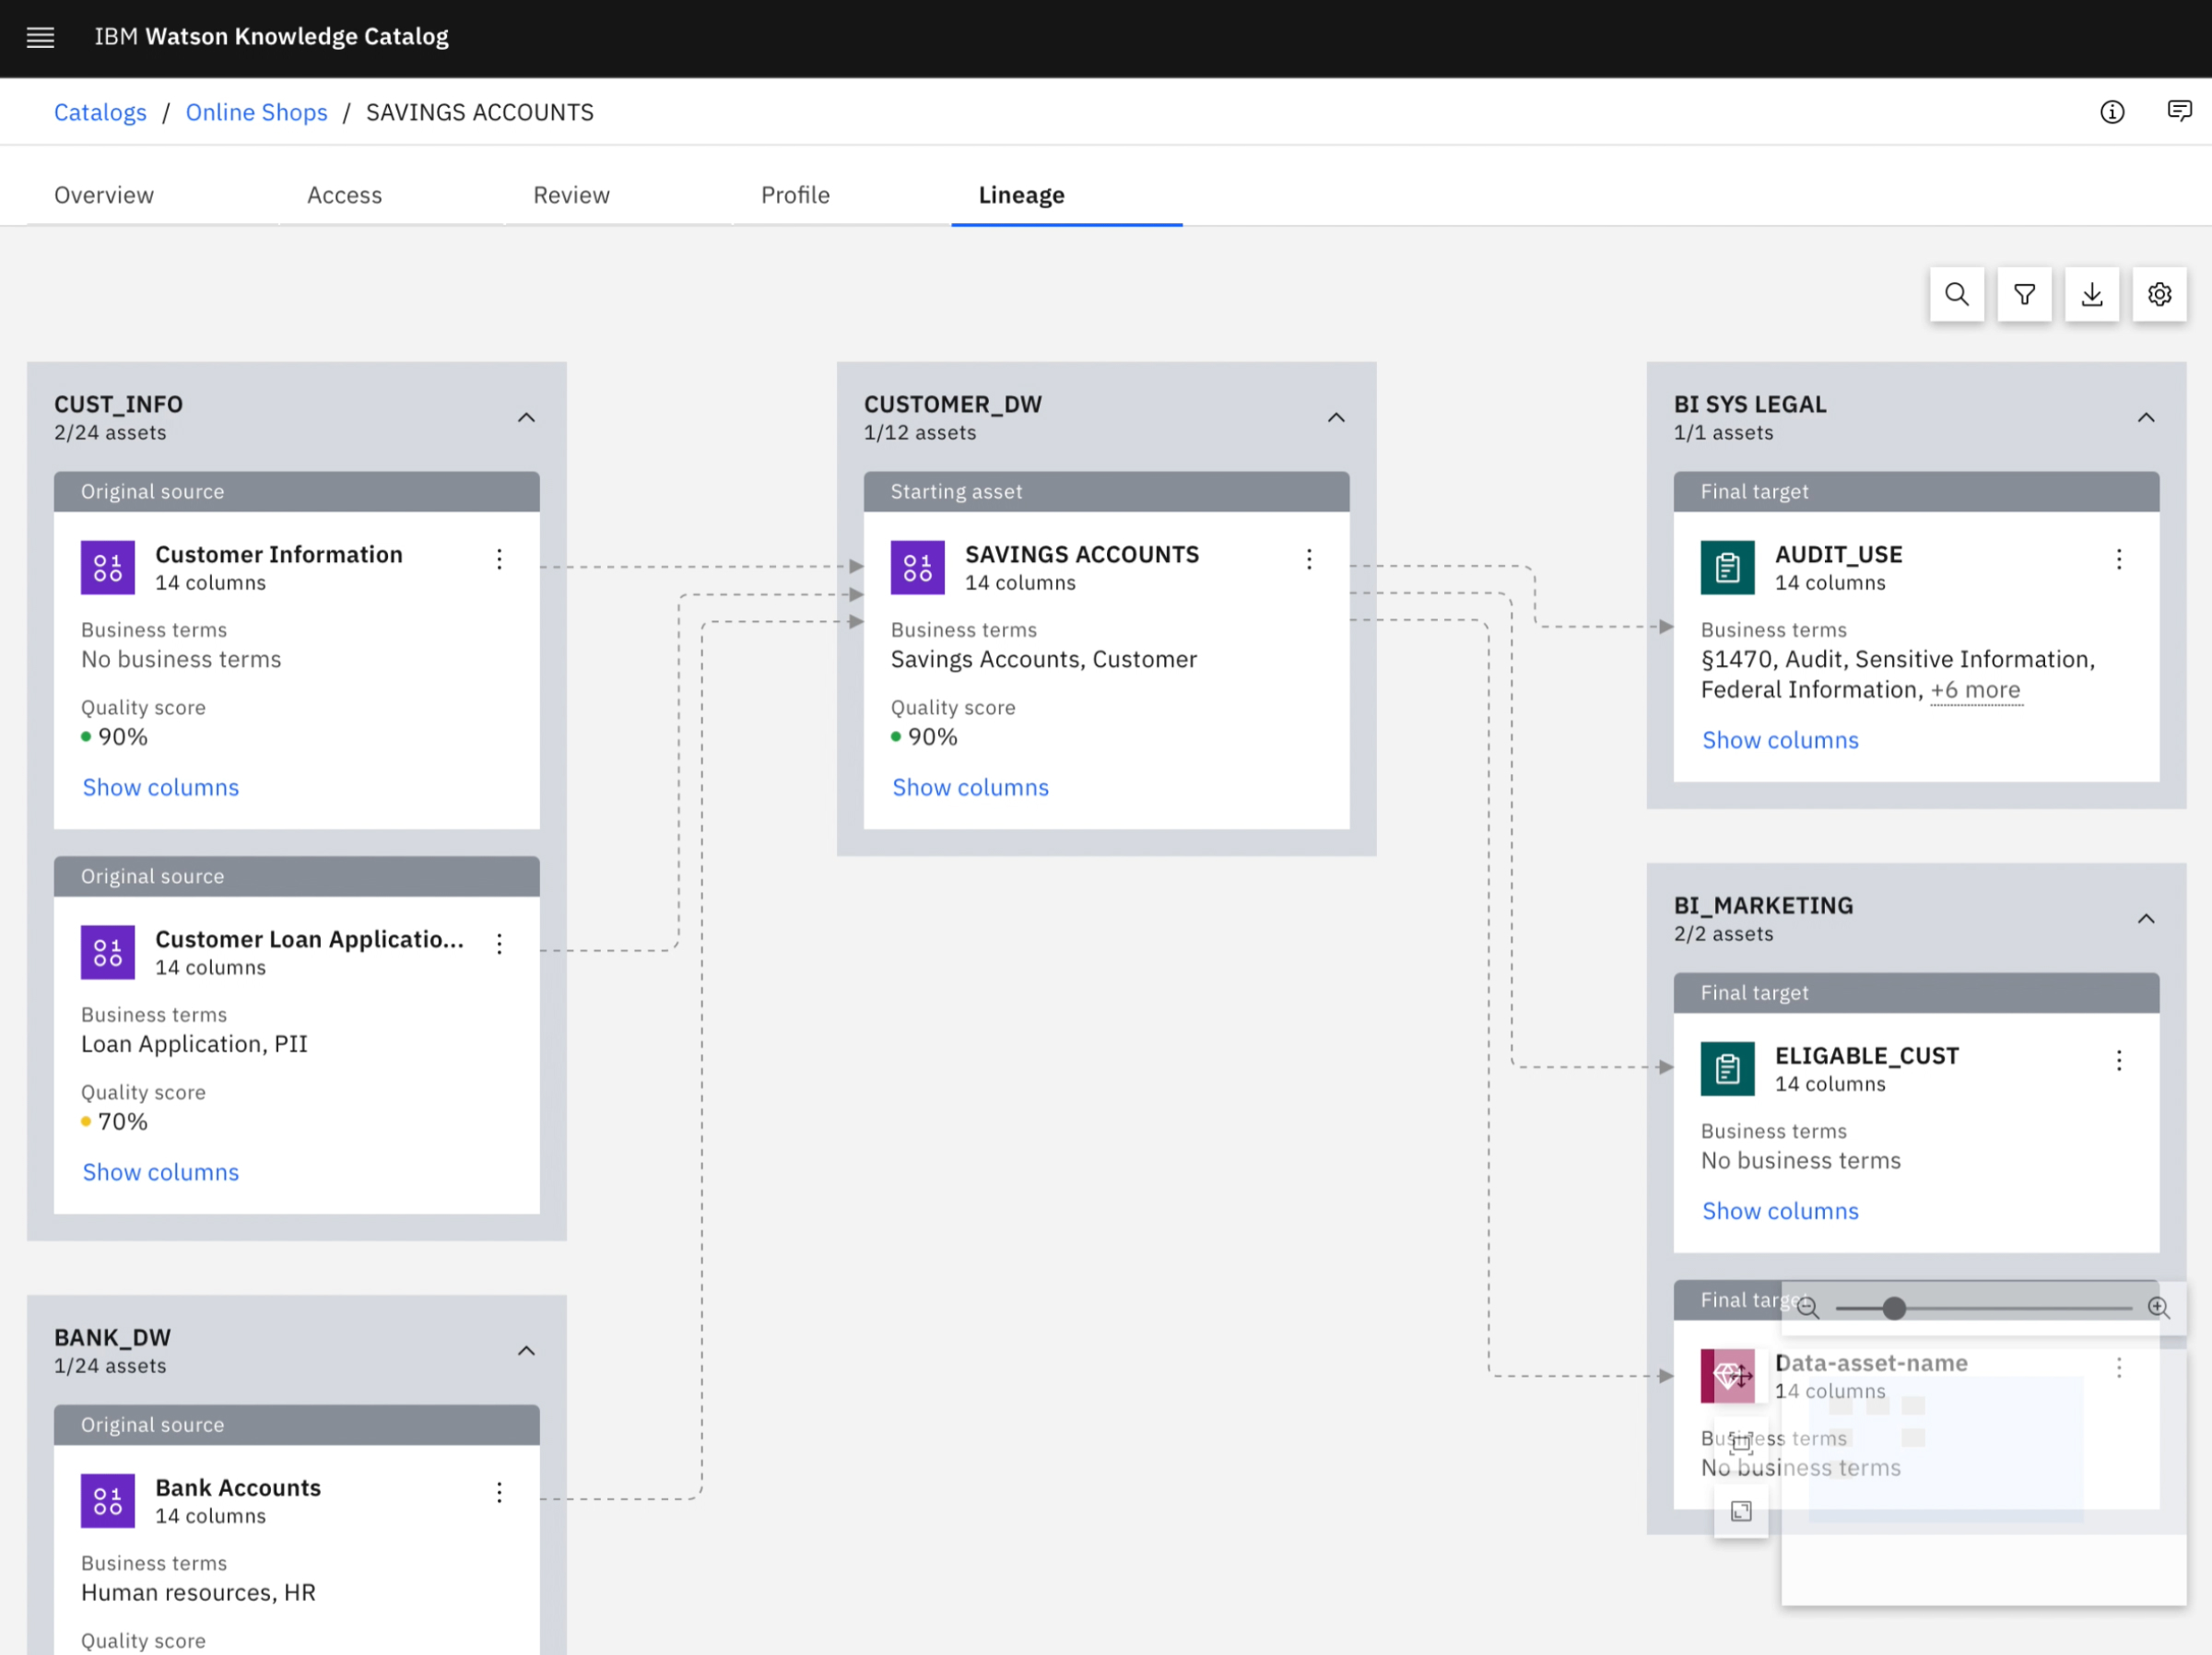
Data Lineage
Data Lineage is a data visualization tool that helps data scientists, data engineers, and business analysts understand where their data comes from, where it goes, and the data transformations it went through. It is essential for data governance. The new data lineage solution reduced load time from hours to seconds and reduced time spent on the data lineage diagram so users could focus on data analytics.
Problem
85% of AI and Machine Learning Models fail due to poor data quality. Data scientists and business analysts struggle to understand the origins of their data and the transformations it undergoes to conduct a complete data quality analysis.
The current data lineage solution has been ignored for the last decade. I had a directive from executive leadership to redefine the data lineage experience.
Goals
IBM has a robust Enterprise Design Thinking framework that I utilized to align product managers, engineering leads, and researchers on product goals.
Consumable
As a business user, I need to easily understand the data lineage diagram so I can ensure my data projects are reliable.
Traceable
As a business and technical user, I need to easily identify where data comes from, where it goes, and the transformations it went through so I can derive my analysis and insights.
Scaleable
As a user from a large enterprise, I need my data lineage diagram to scale for complex graphs.
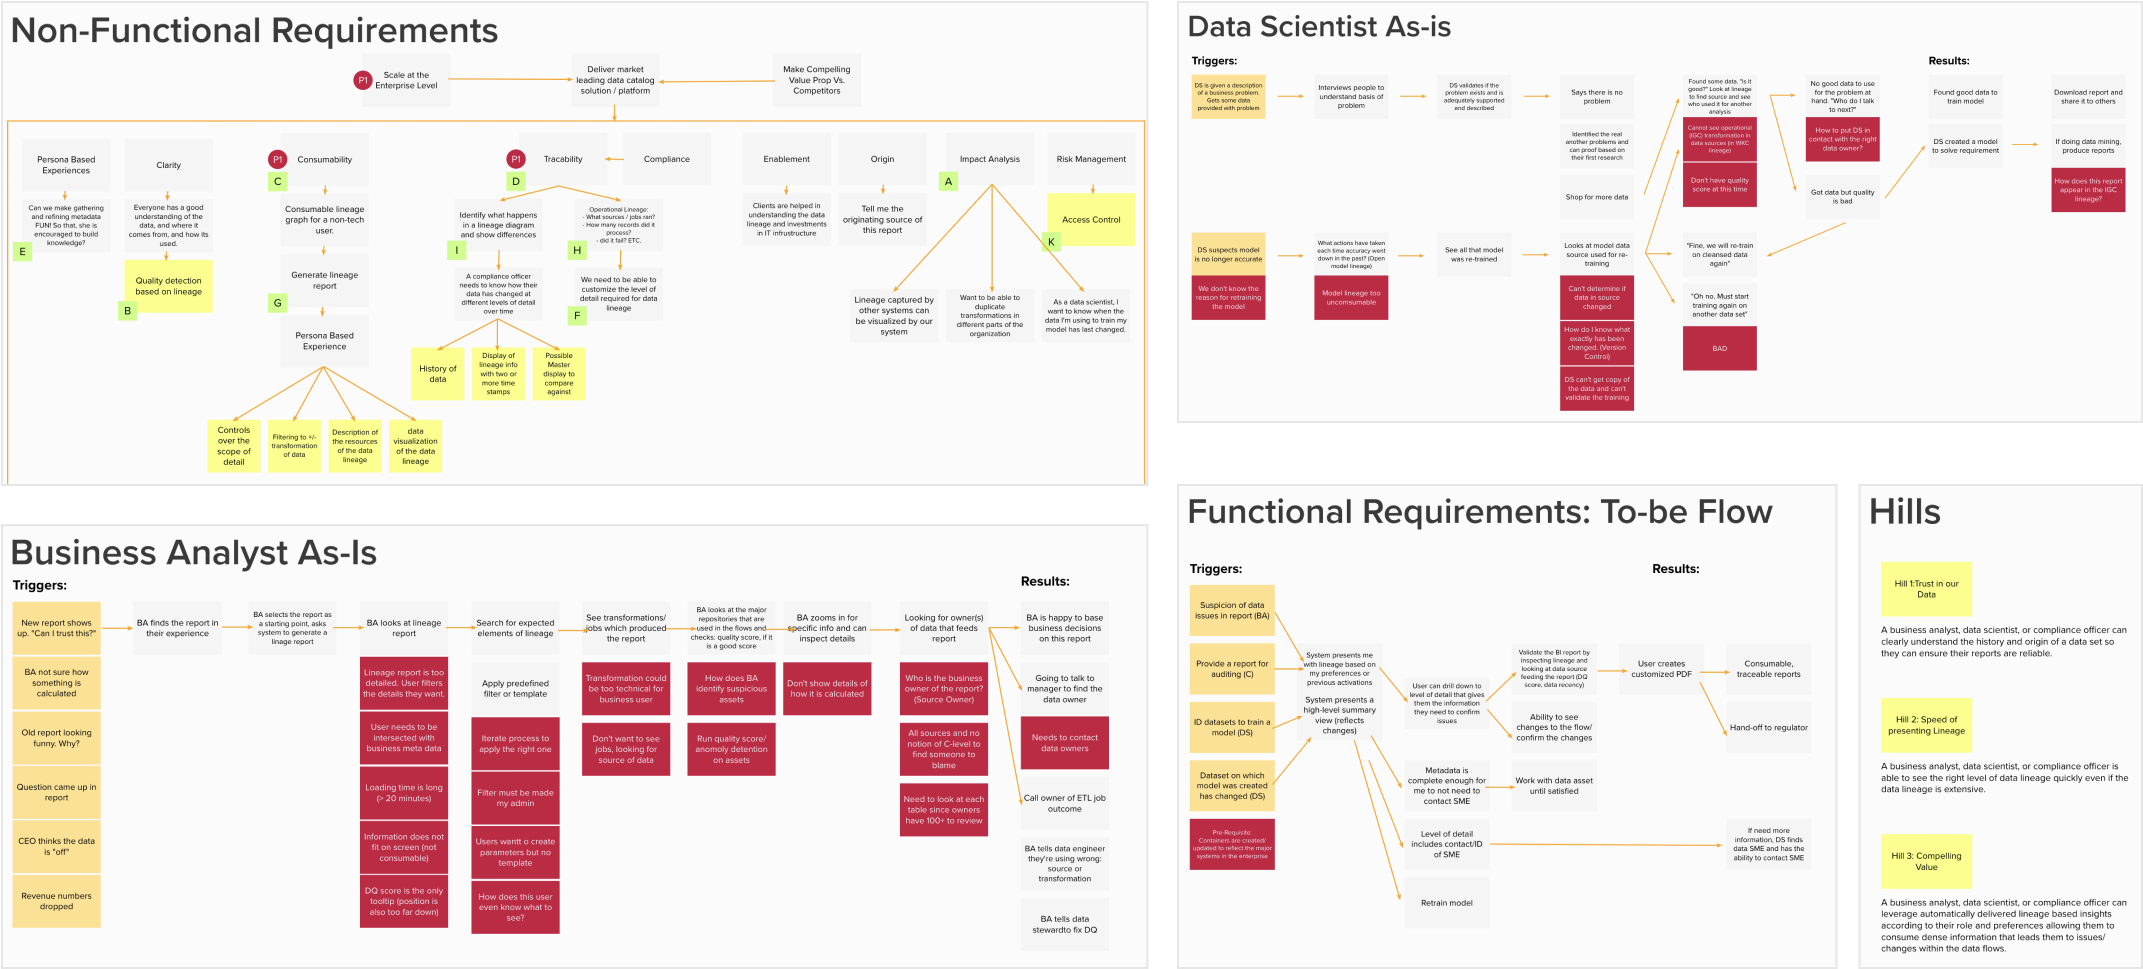
Research
I collaborated with my UX Researcher to understand and validate user needs. We conducted several user research methodologies like heuristic evaluation, competitive analysis, user interviews, user feedback, and sponsor user testing to synthesize these key insights:
Flexible User Interface
Users preferred our competitor’s “modern” UI which provided them more flexibility and control to change their lineage diagram.
Disruptions in Workflow
Through user interviews, we discovered how many steps and pages it took to find the information they needed to complete their job.
Technical Information
Business analysts could not understand the technical data and needed a data scientist to decipher that information.
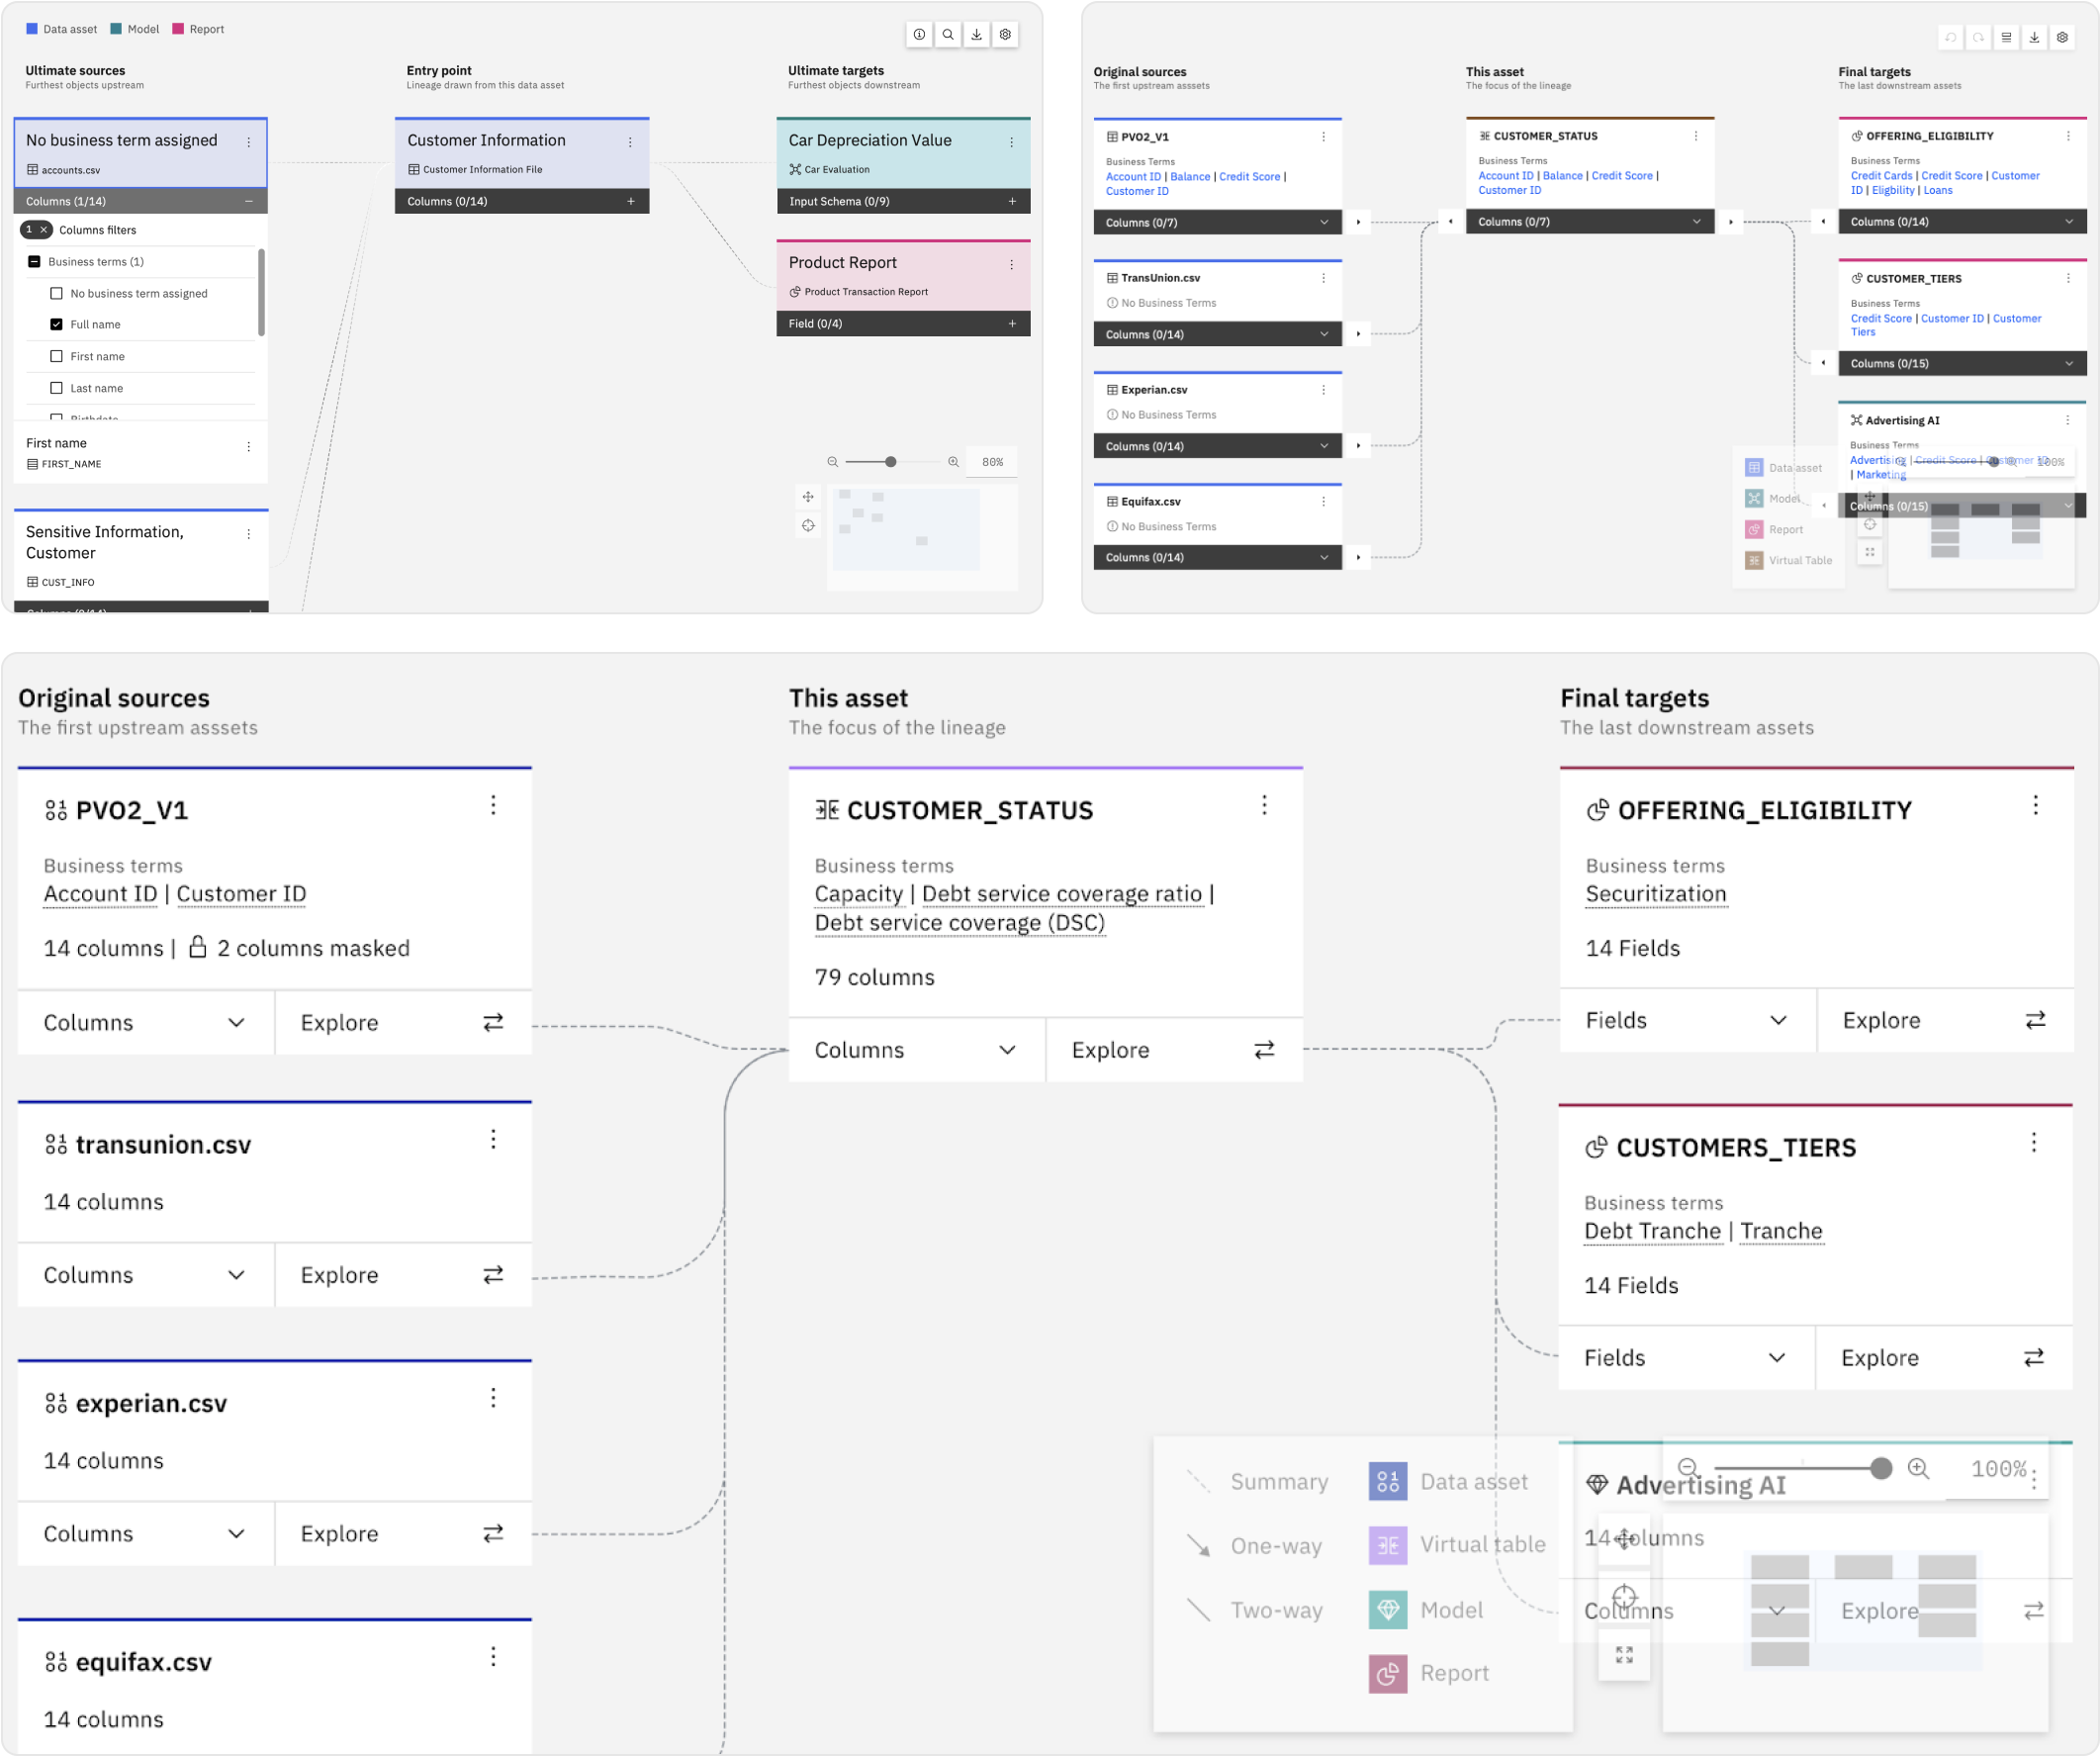
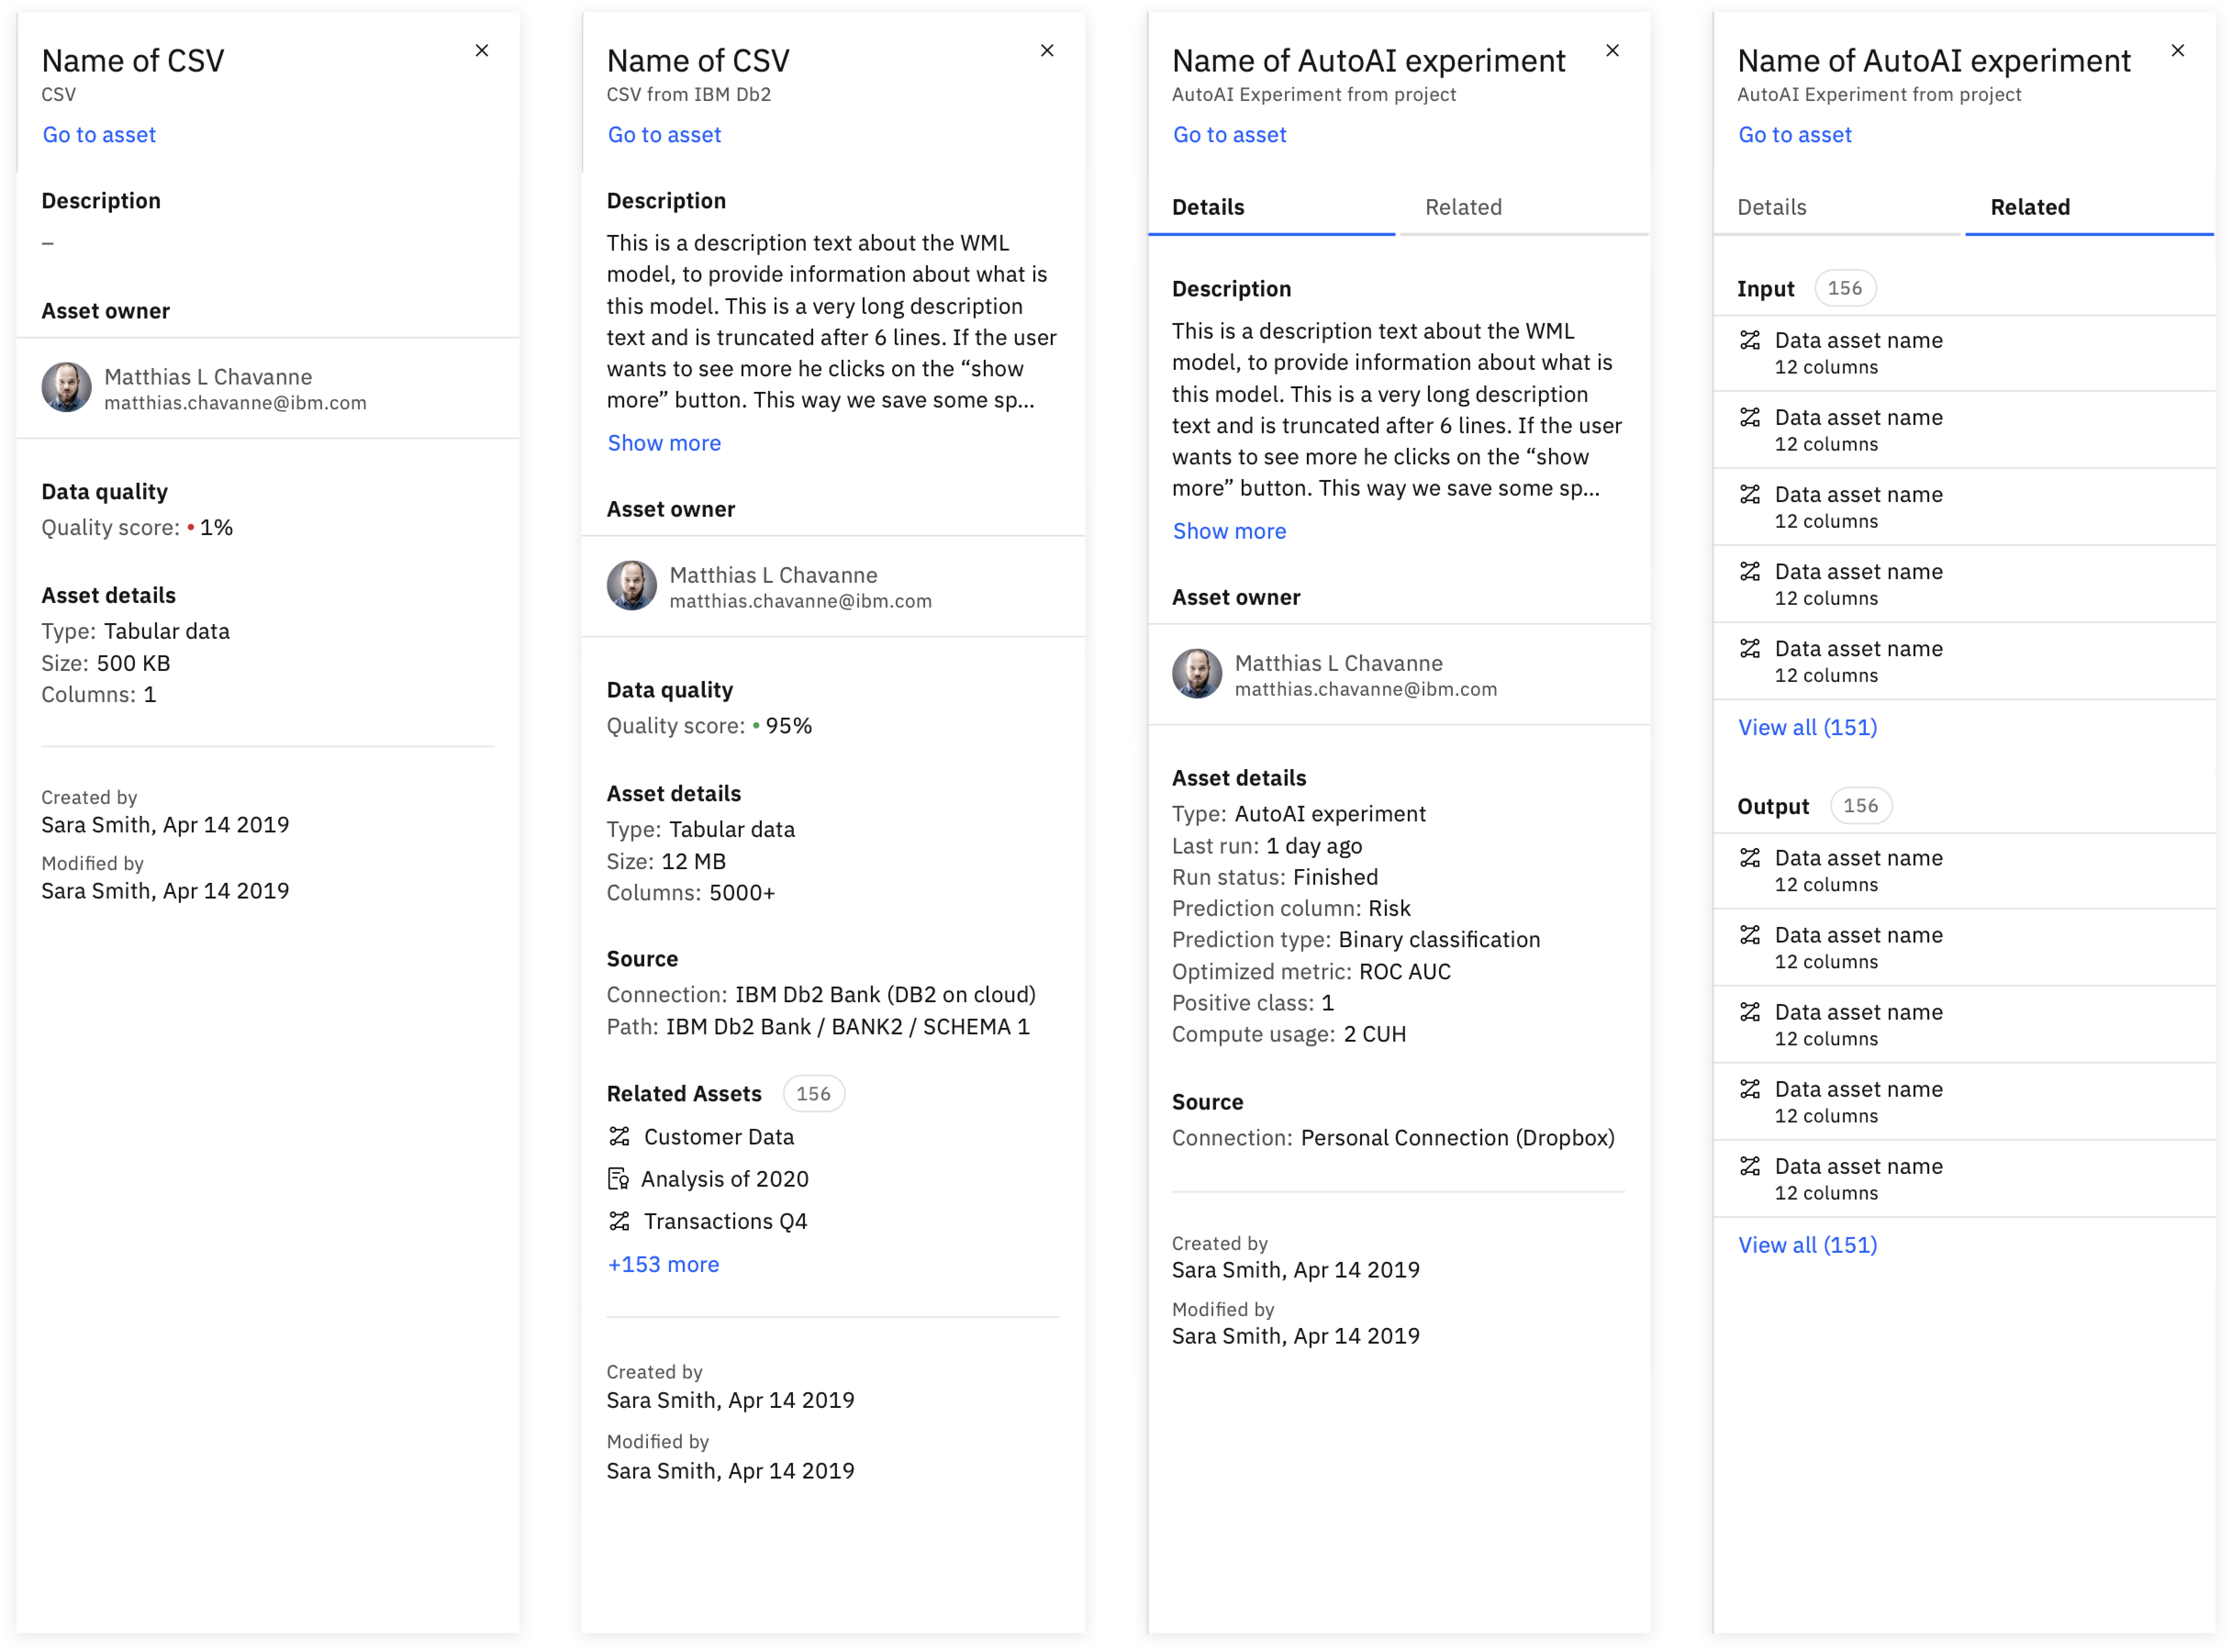
Summary View
Users do not care about all the information in the middle. They want to see their data origin and drill down to see more details.
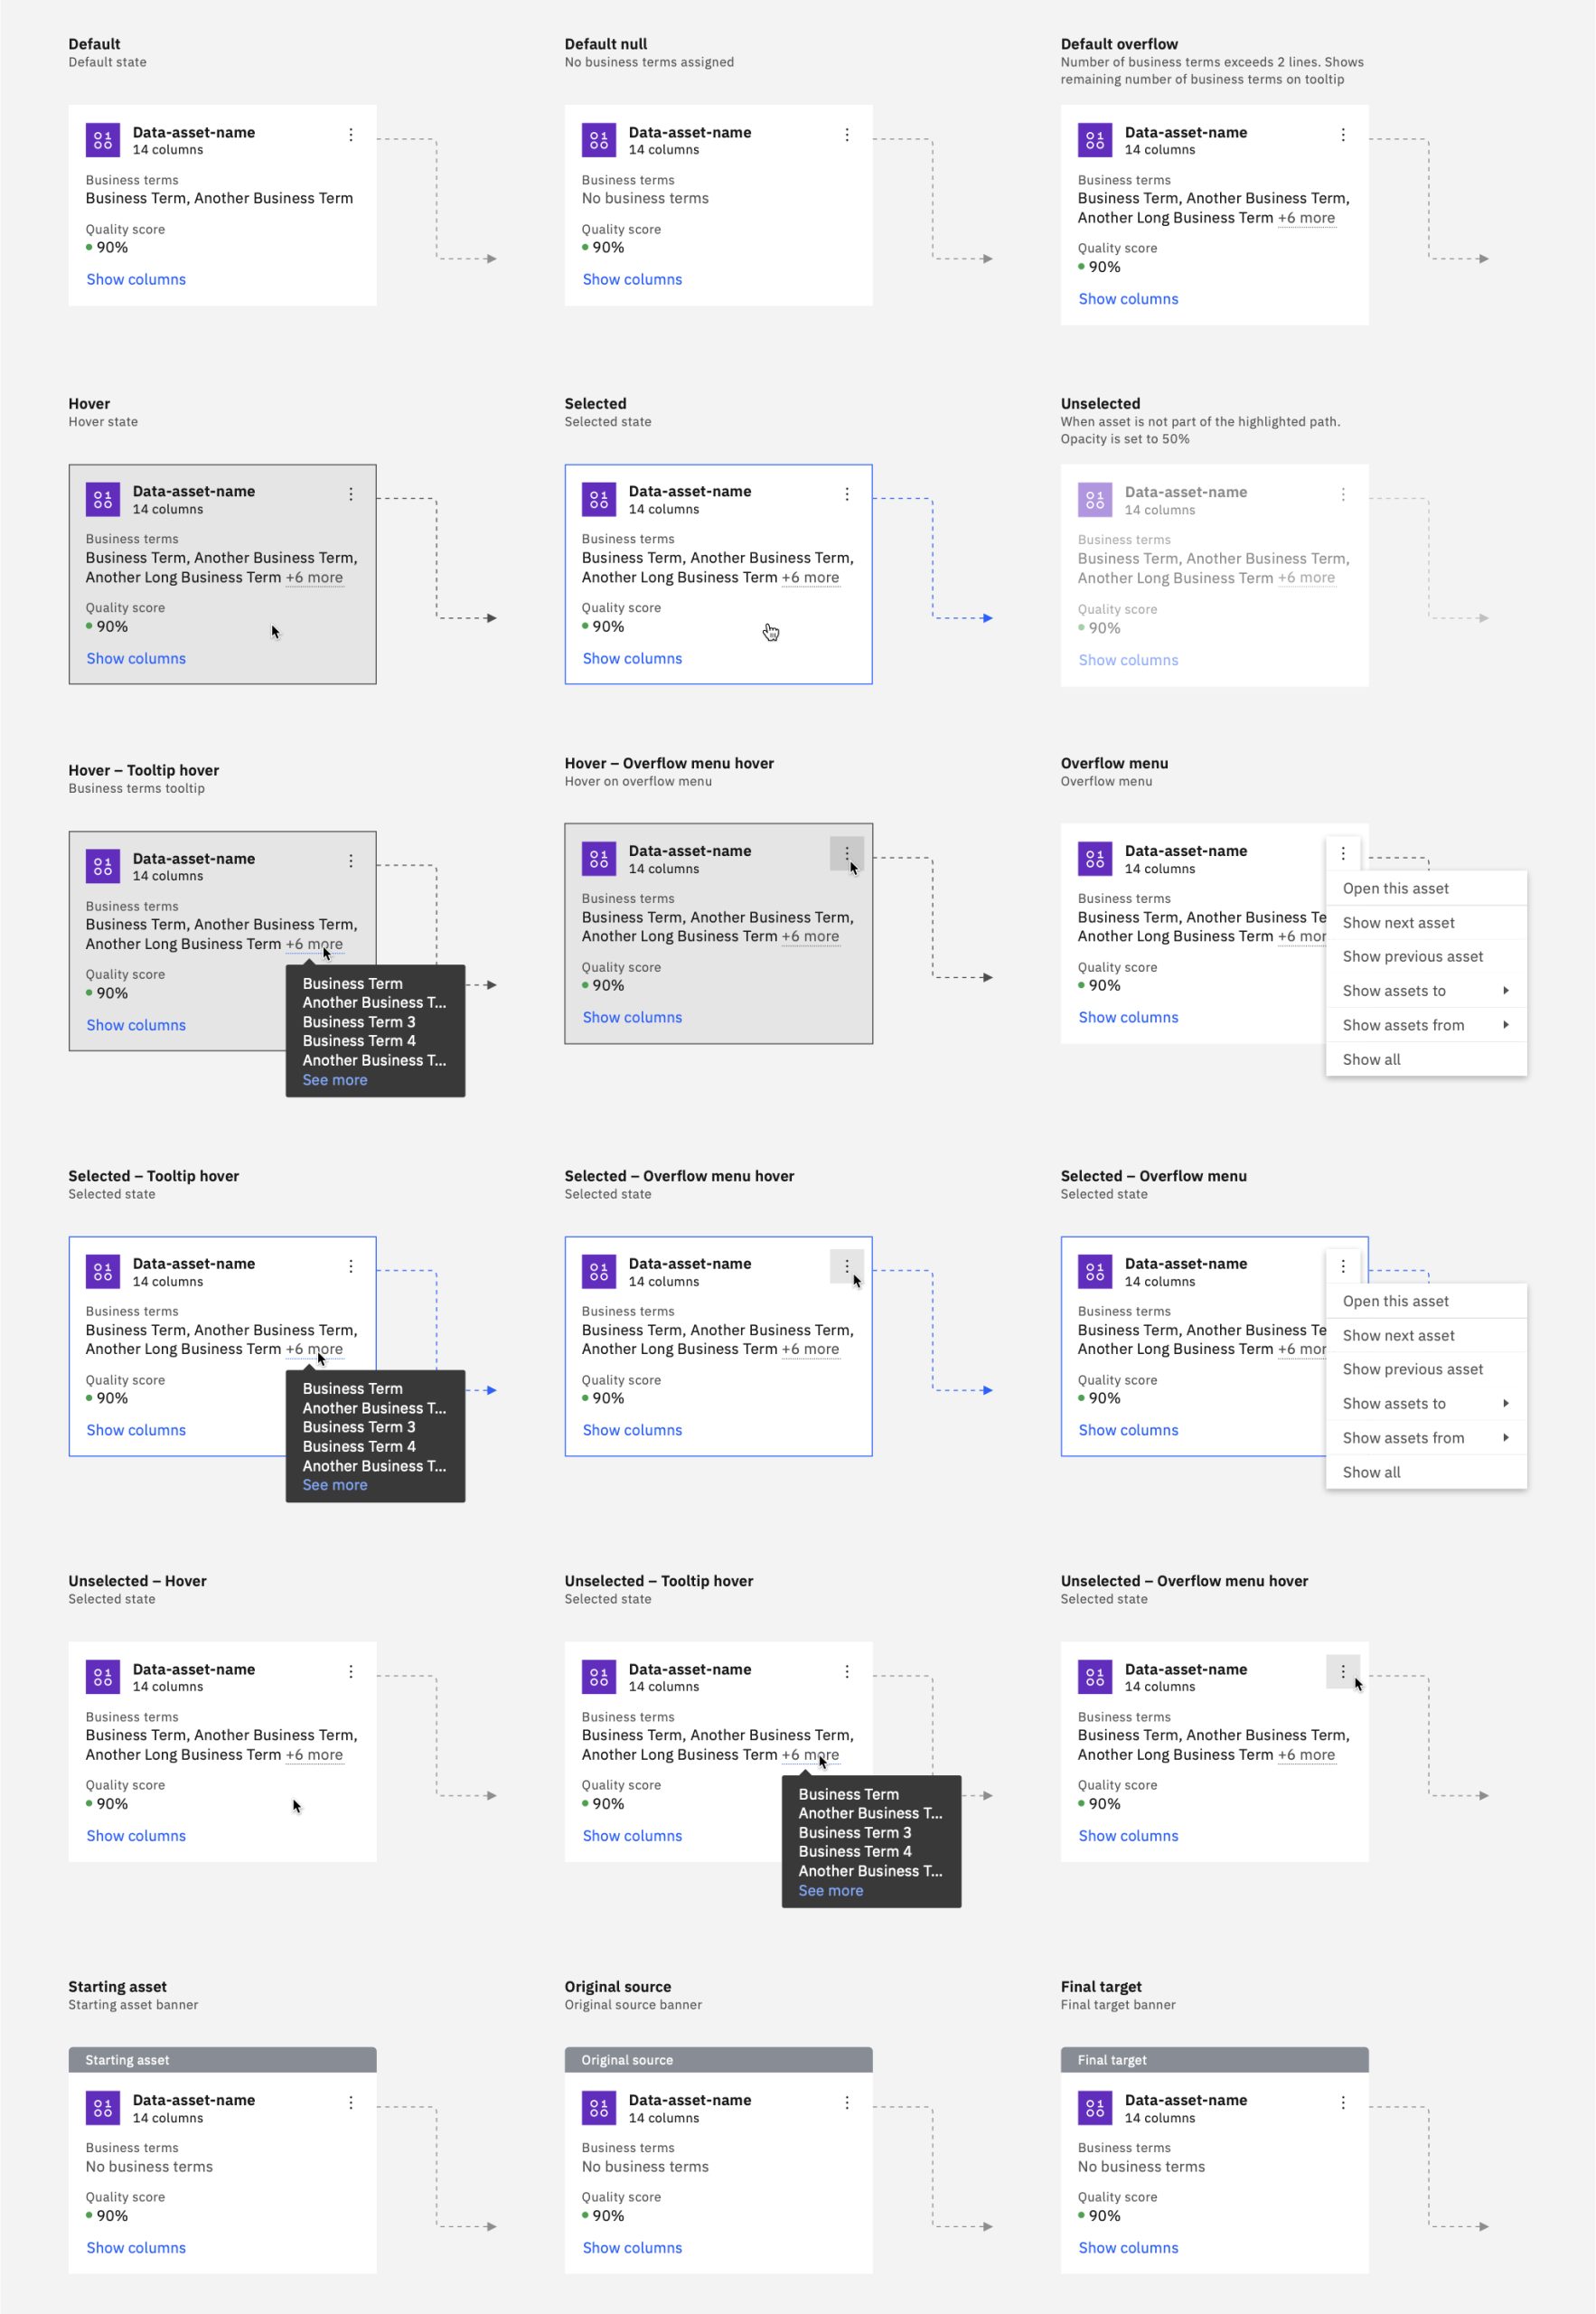
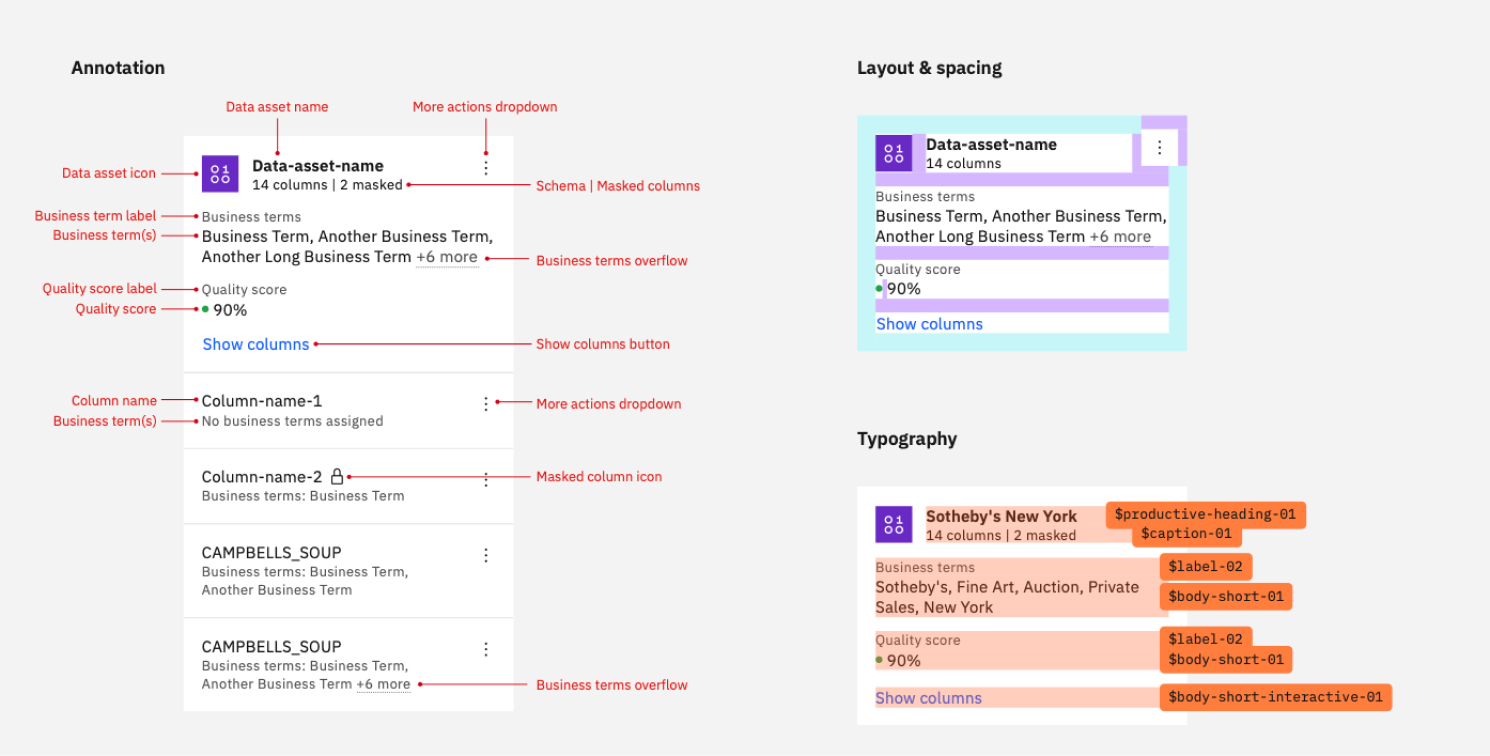
Design Exploration – Nodes
Nodes are the first level of information hierarchy in the data lineage diagram. It needs to emit the most important information for a user to understand what they looking at without cognitively overloading them.

Design Exploration – Summary View
Based on user research, I explored and tested the summary view concept. The summary view reduced the amount of time to load complex data lineage diagrams from hours to minutes.
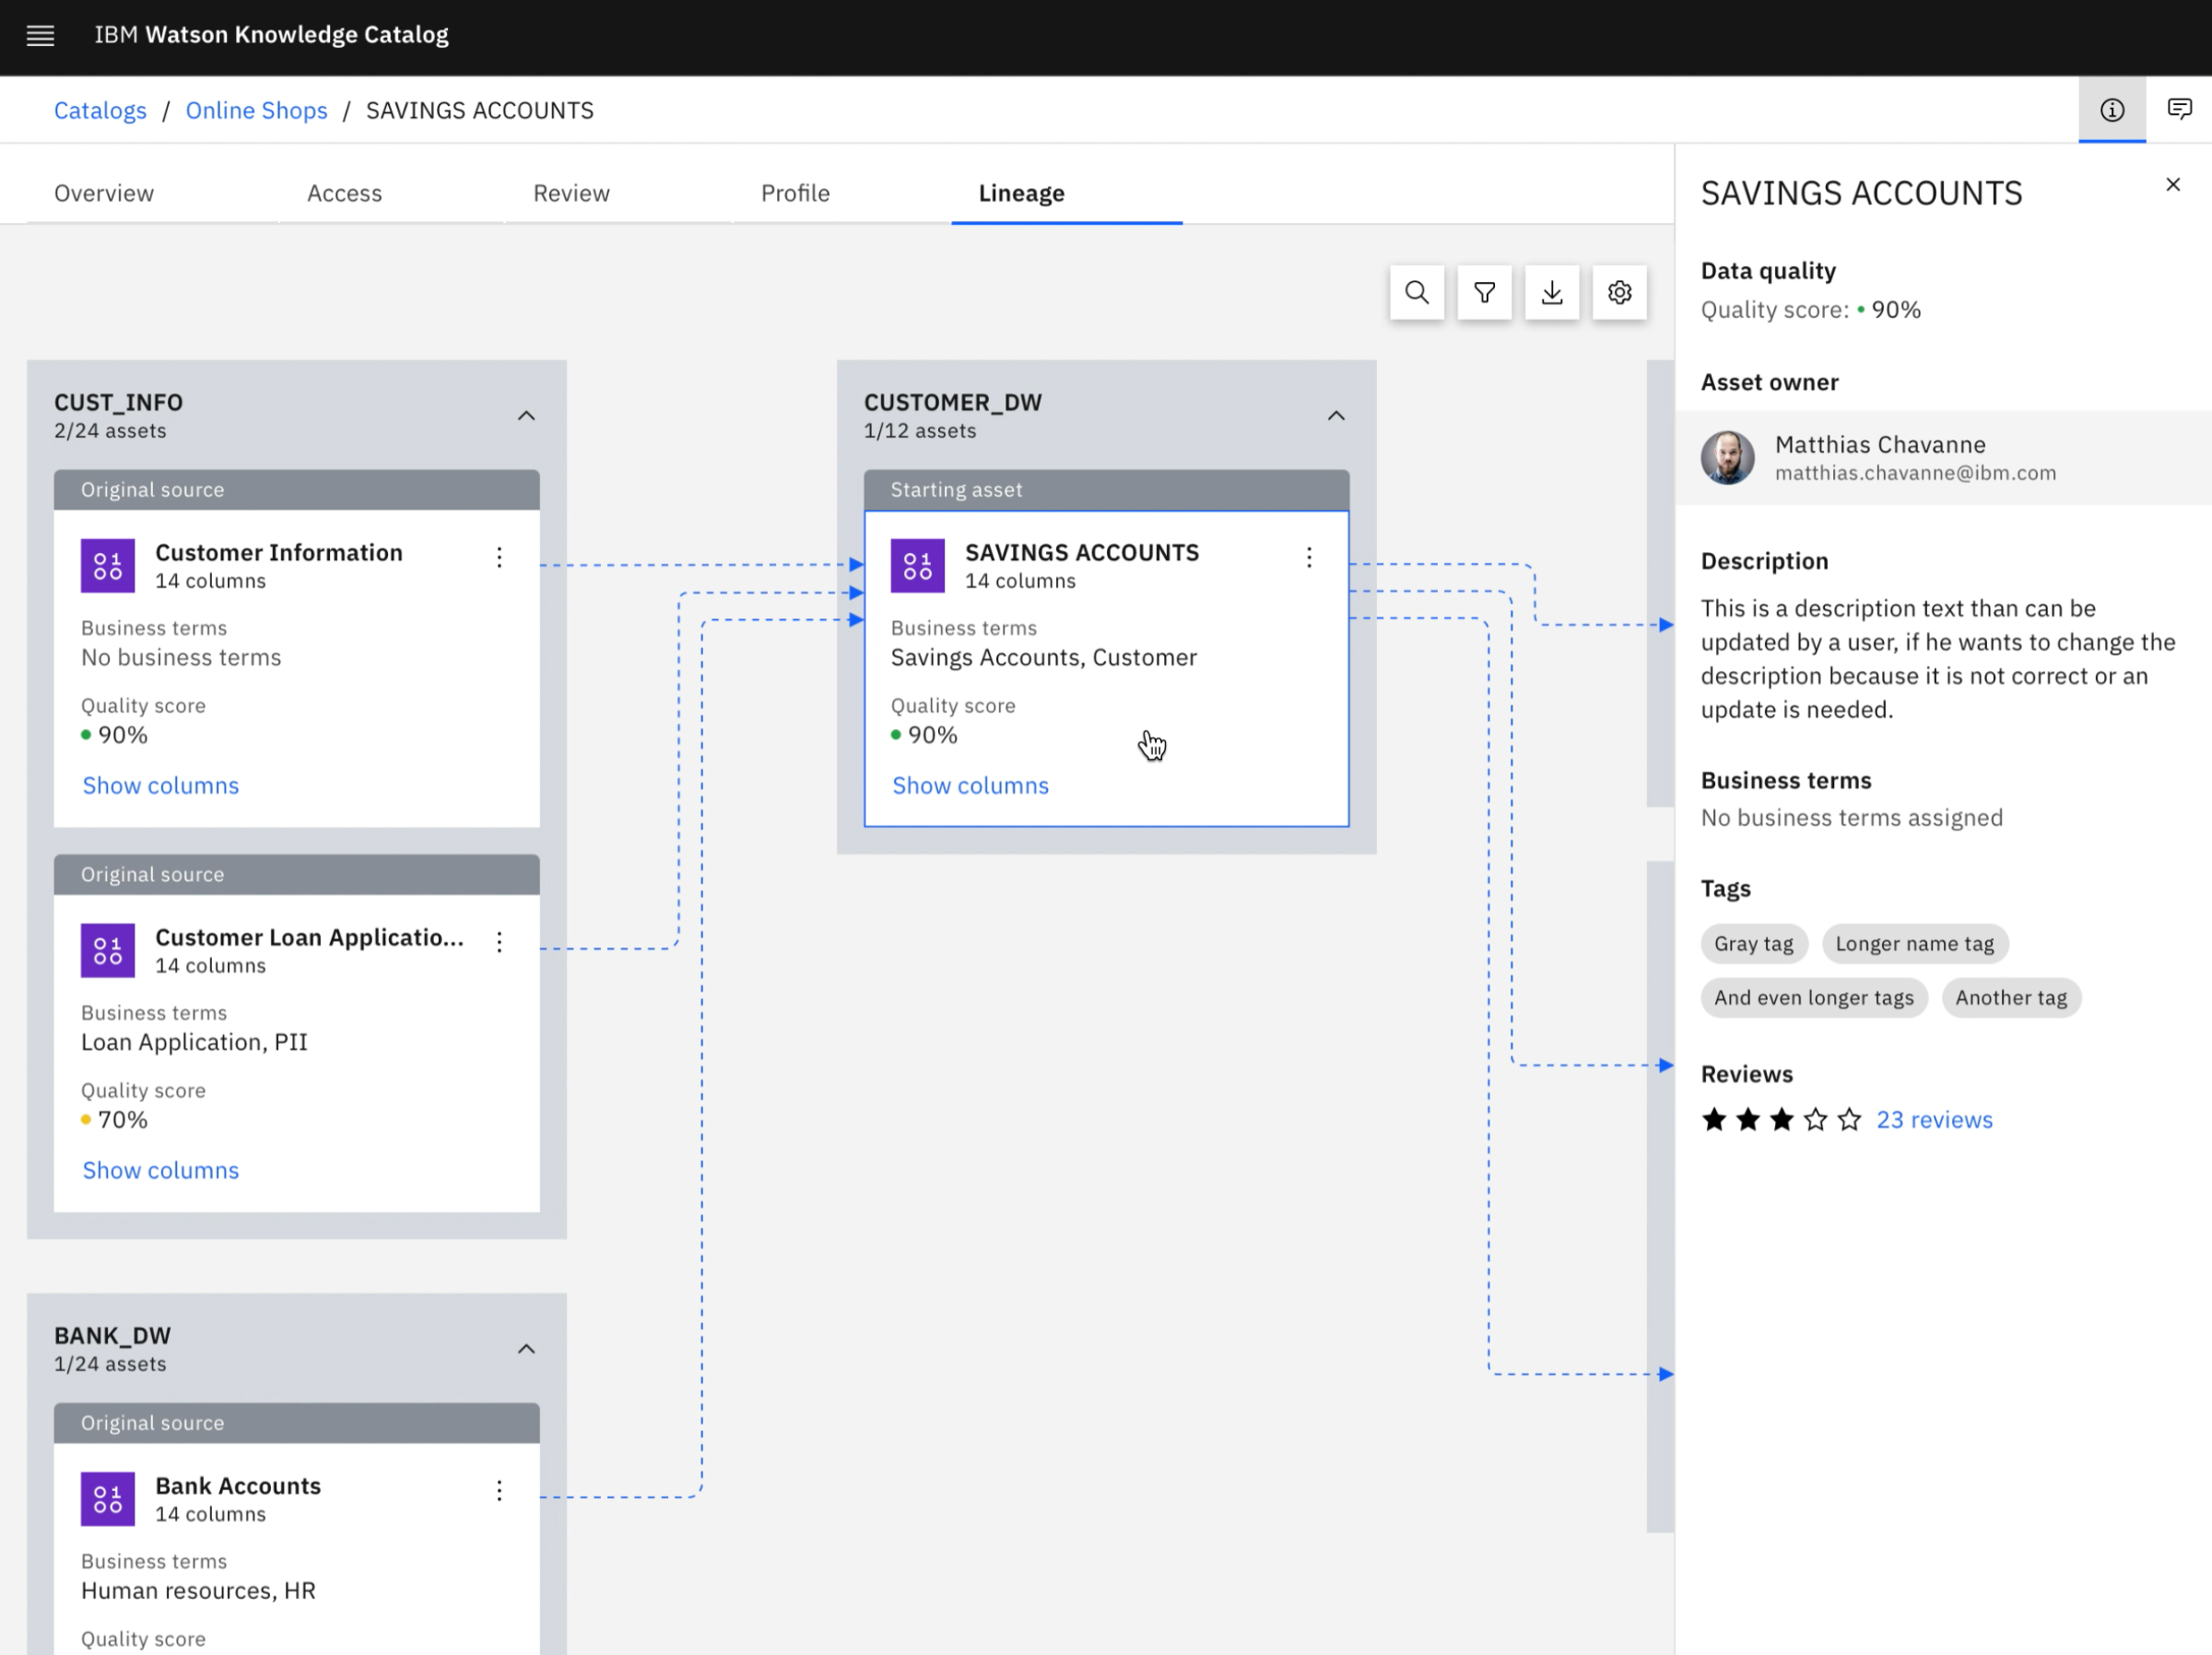
Testing Interaction Designs
Because Data Lineage is a data visualization graph, testing interaction designs is essential to the user experience. The interactions I tested were Adding Nodes, Showing Columns, and Selecting a Node.
Design Consistency
Design inconsistencies across IBM were affecting the overall user experience. I worked with several other product teams to identify and unify design inconsistencies across data visualization features and information panels. The unification of design patterns led to an increase in design quality. I designed and developed a node component library. The component library led to faster prototyping for designers and developers.
All | CapitalConnect | Data Lineage | Watson Knowledge Catalog | AuditBoard | Time Tracking | Files & Folders
All | Data Lineage | Watson Knowledge Catalog | CompsFinder | AuditBoard | Time Tracking | Files & Folders