90% of the world data was created in the last 2 years and 2.5 quintillion bytes of data are created everyday.
Watson Knowledge Catalog is a data governance platform that manages and organizes data so users can easily find, understand, and access their data.
Data scientists, data engineers, data stewards, and business analysts rely on it to understand data quality, create rules and policies for data security, and transform data to make it usable for and available to train machine learning models.
Watson Knowledge Catalog
85% AI models fail due to poor data quality
Users were struggling to understand the changes in their data flow and transformations.
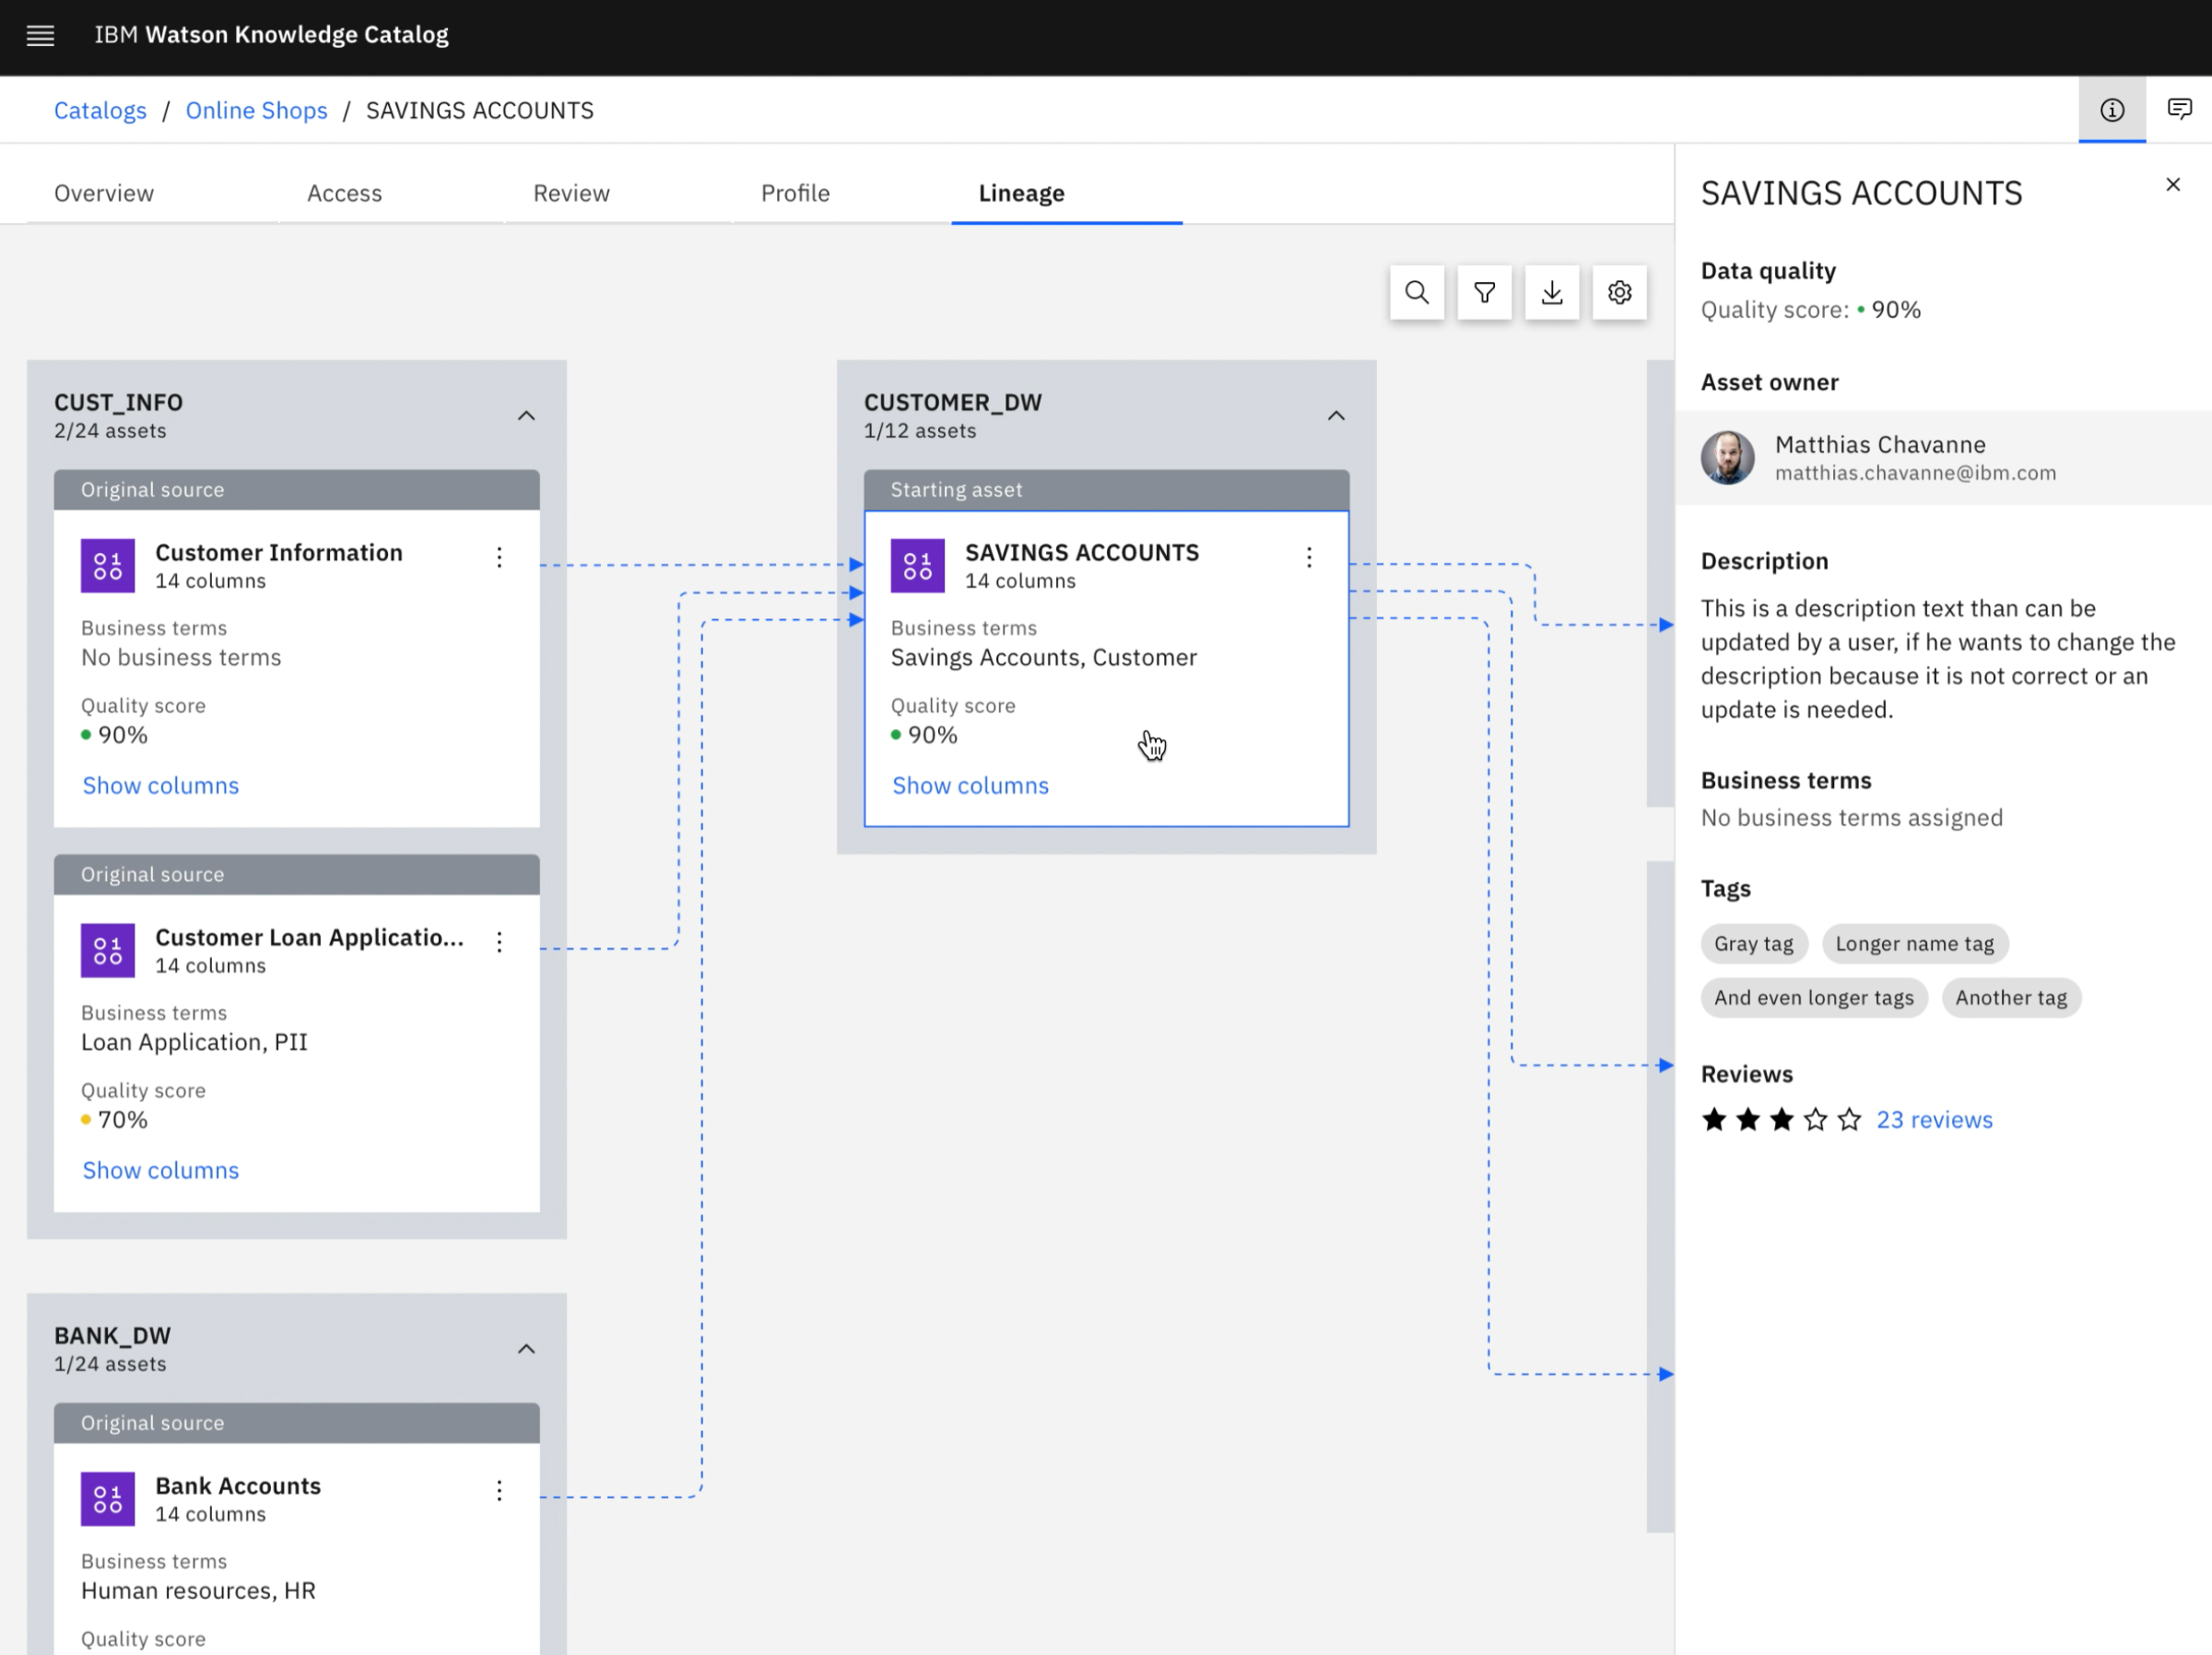
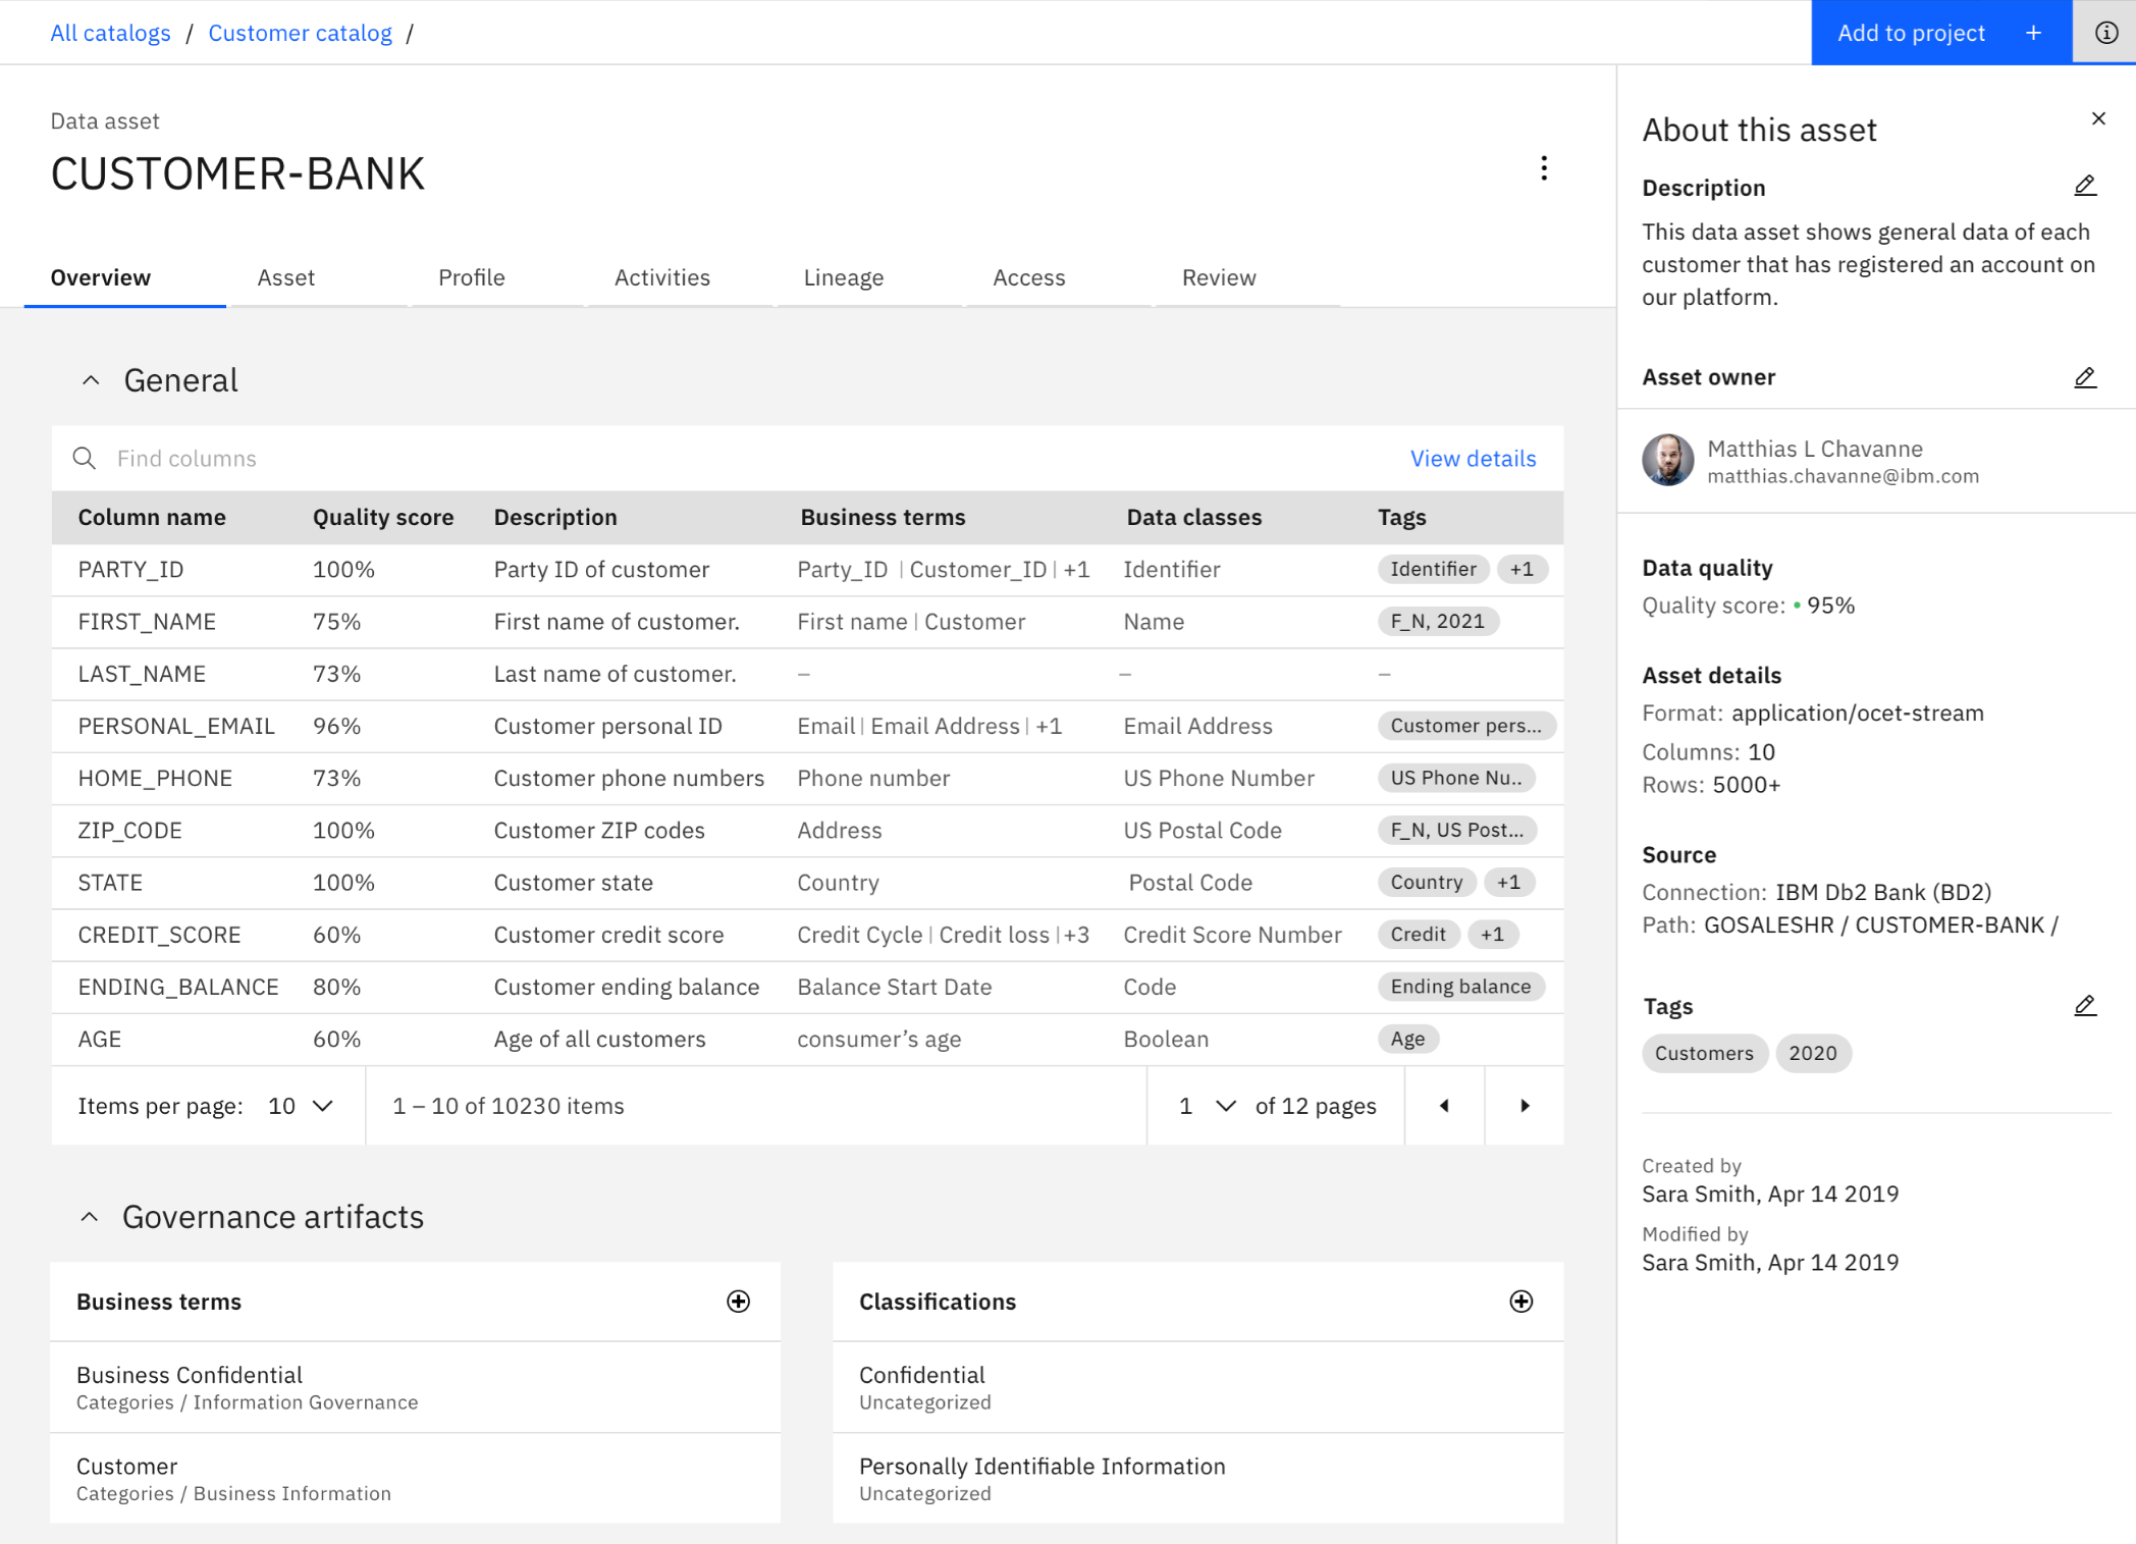
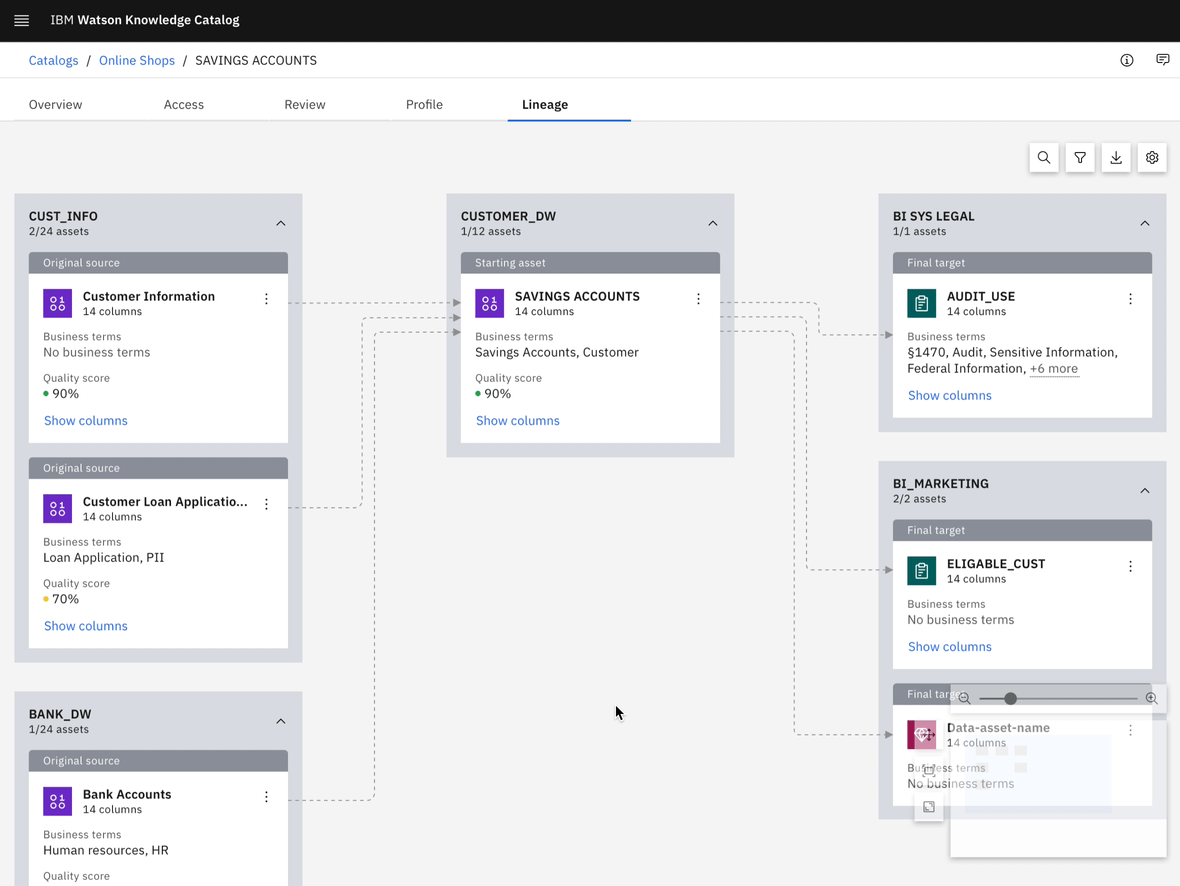
Data Lineage is a data governance visualization tool that helps data scientists, data engineers, and business analysts understand where their data comes from, where it goes to, and the data transformations it goes through.
The new data lineage solution reduced load time from hours to seconds and reduced time spent understanding complex diagrams, so users can focus on data analytics.
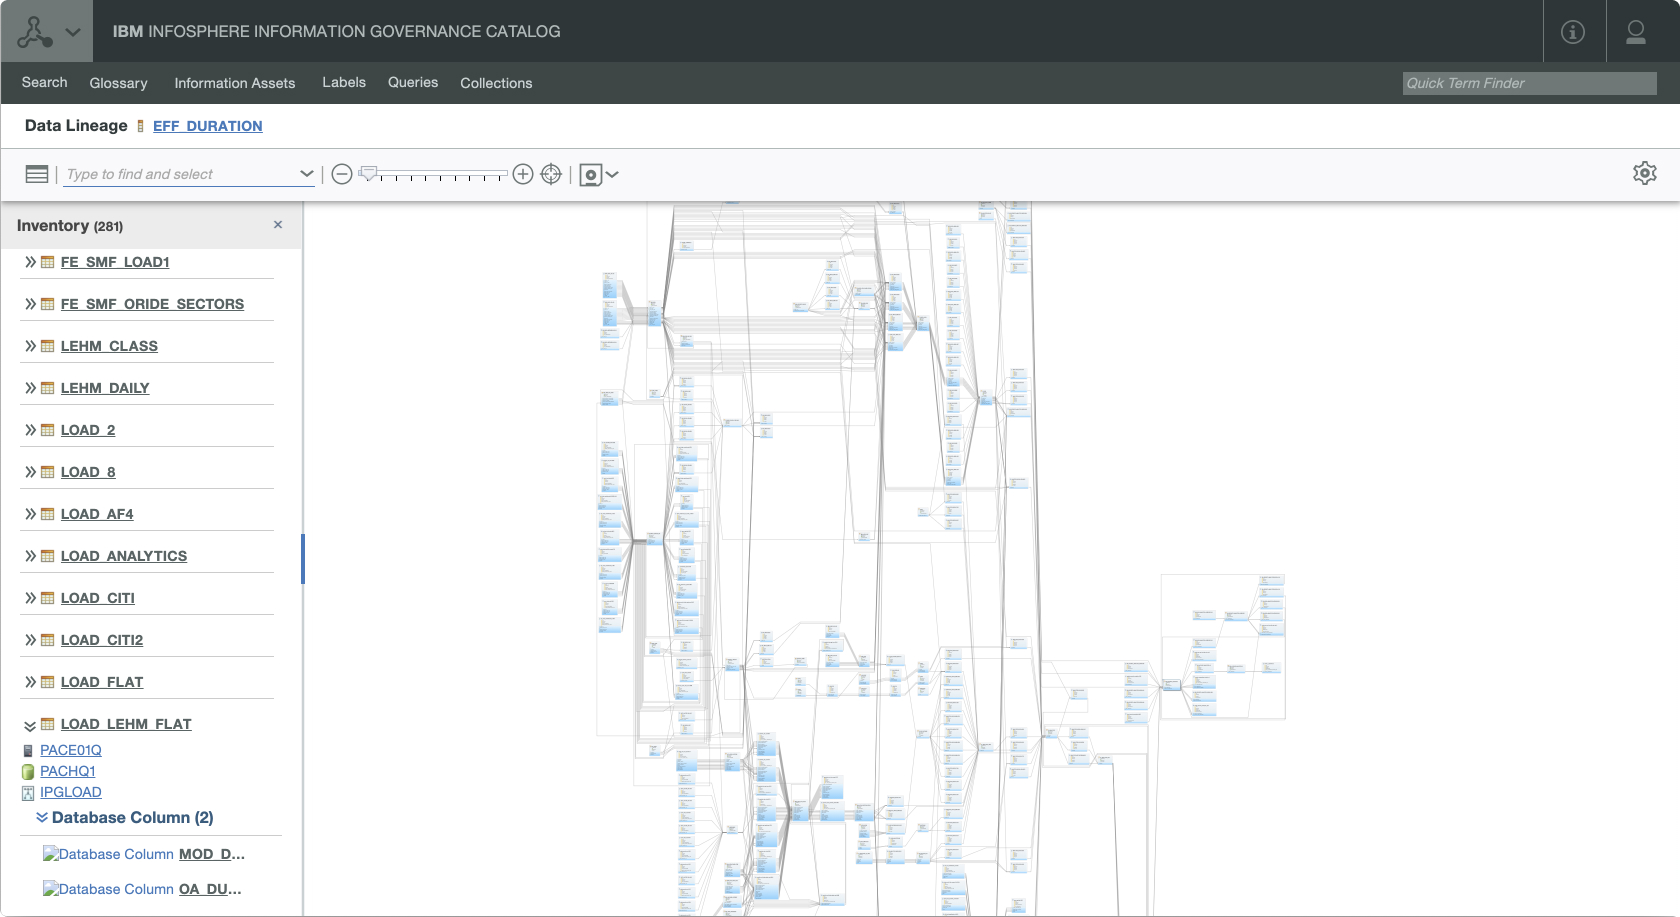
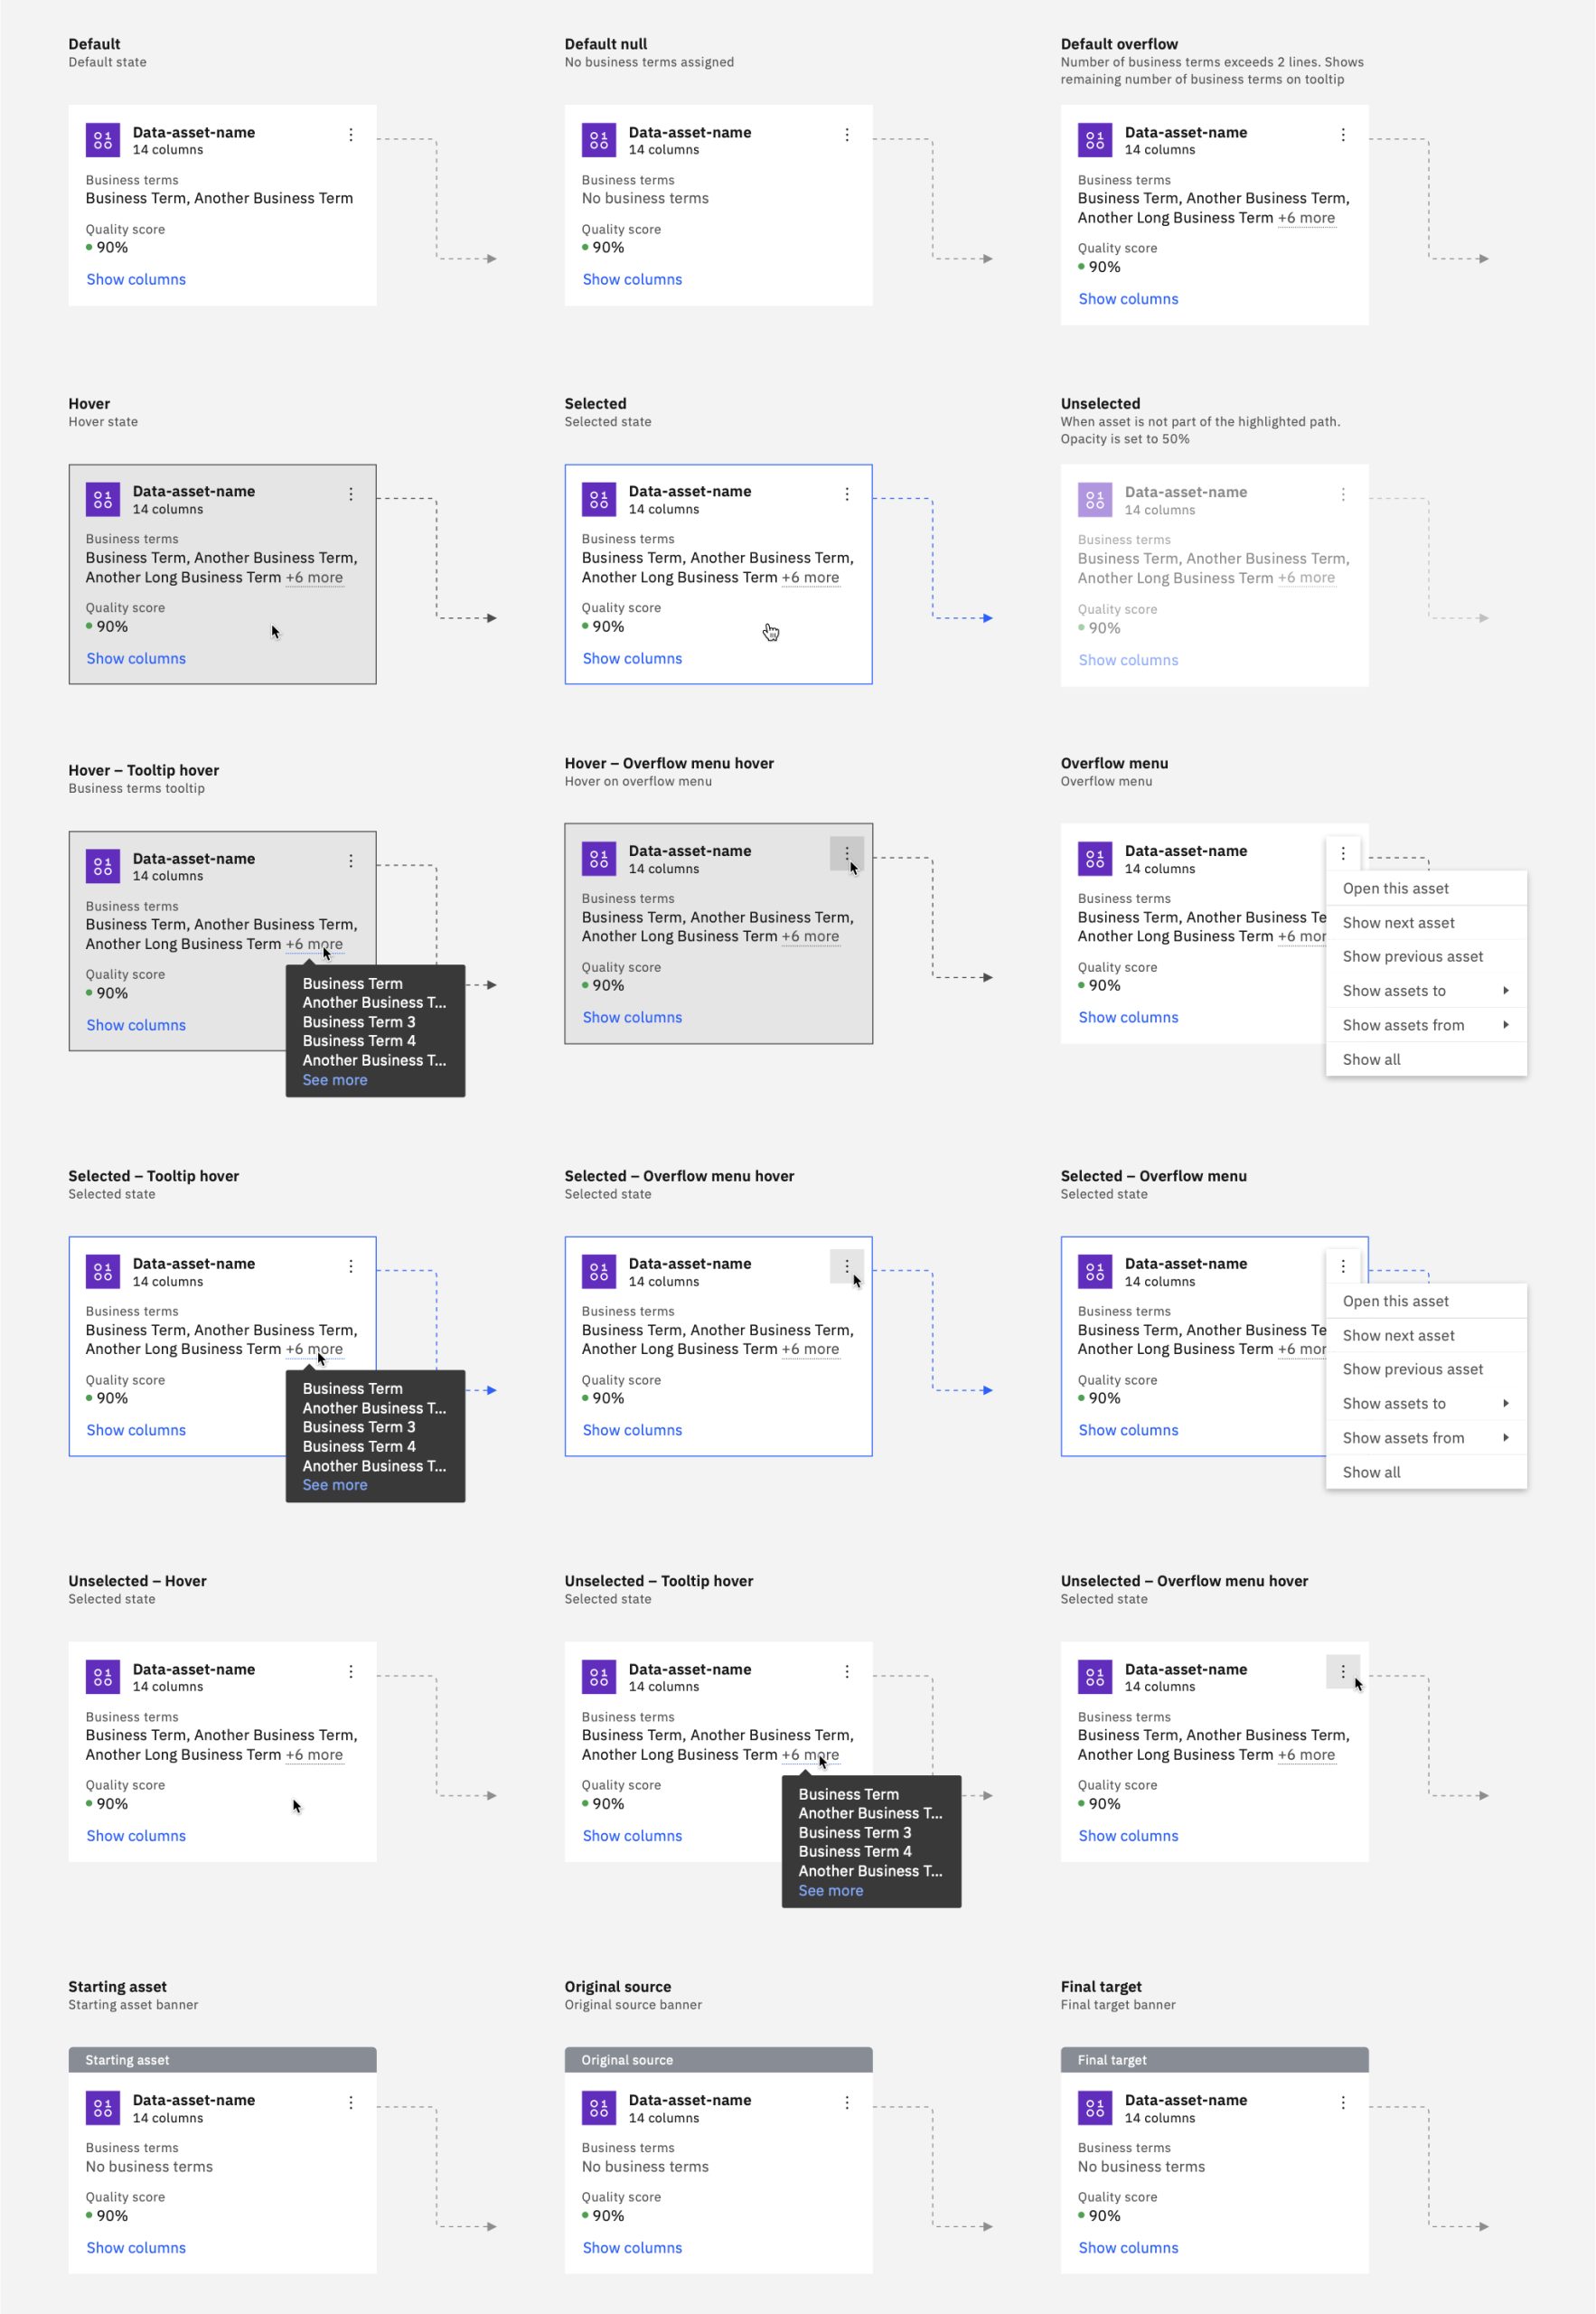
Data Lineage before
Conducting an Enterprise Designing Thinking workshop to align stakeholders
I conducted an Enterprise Design Thinking workshop to align product managers, engineering leads, and researchers, and established three product goals based on user needs.
Consumable. As a business user, I need to easily understand the data lineage diagram so I can ensure my data projects are reliable.
Traceable. As a business and technical user, I need to easily identify where data comes from, where it goes, and the transformations it went through so I can derive my analysis and insights.
Scalable. As a user from a large enterprise, I need my data lineage diagram to scale for complex graphs.
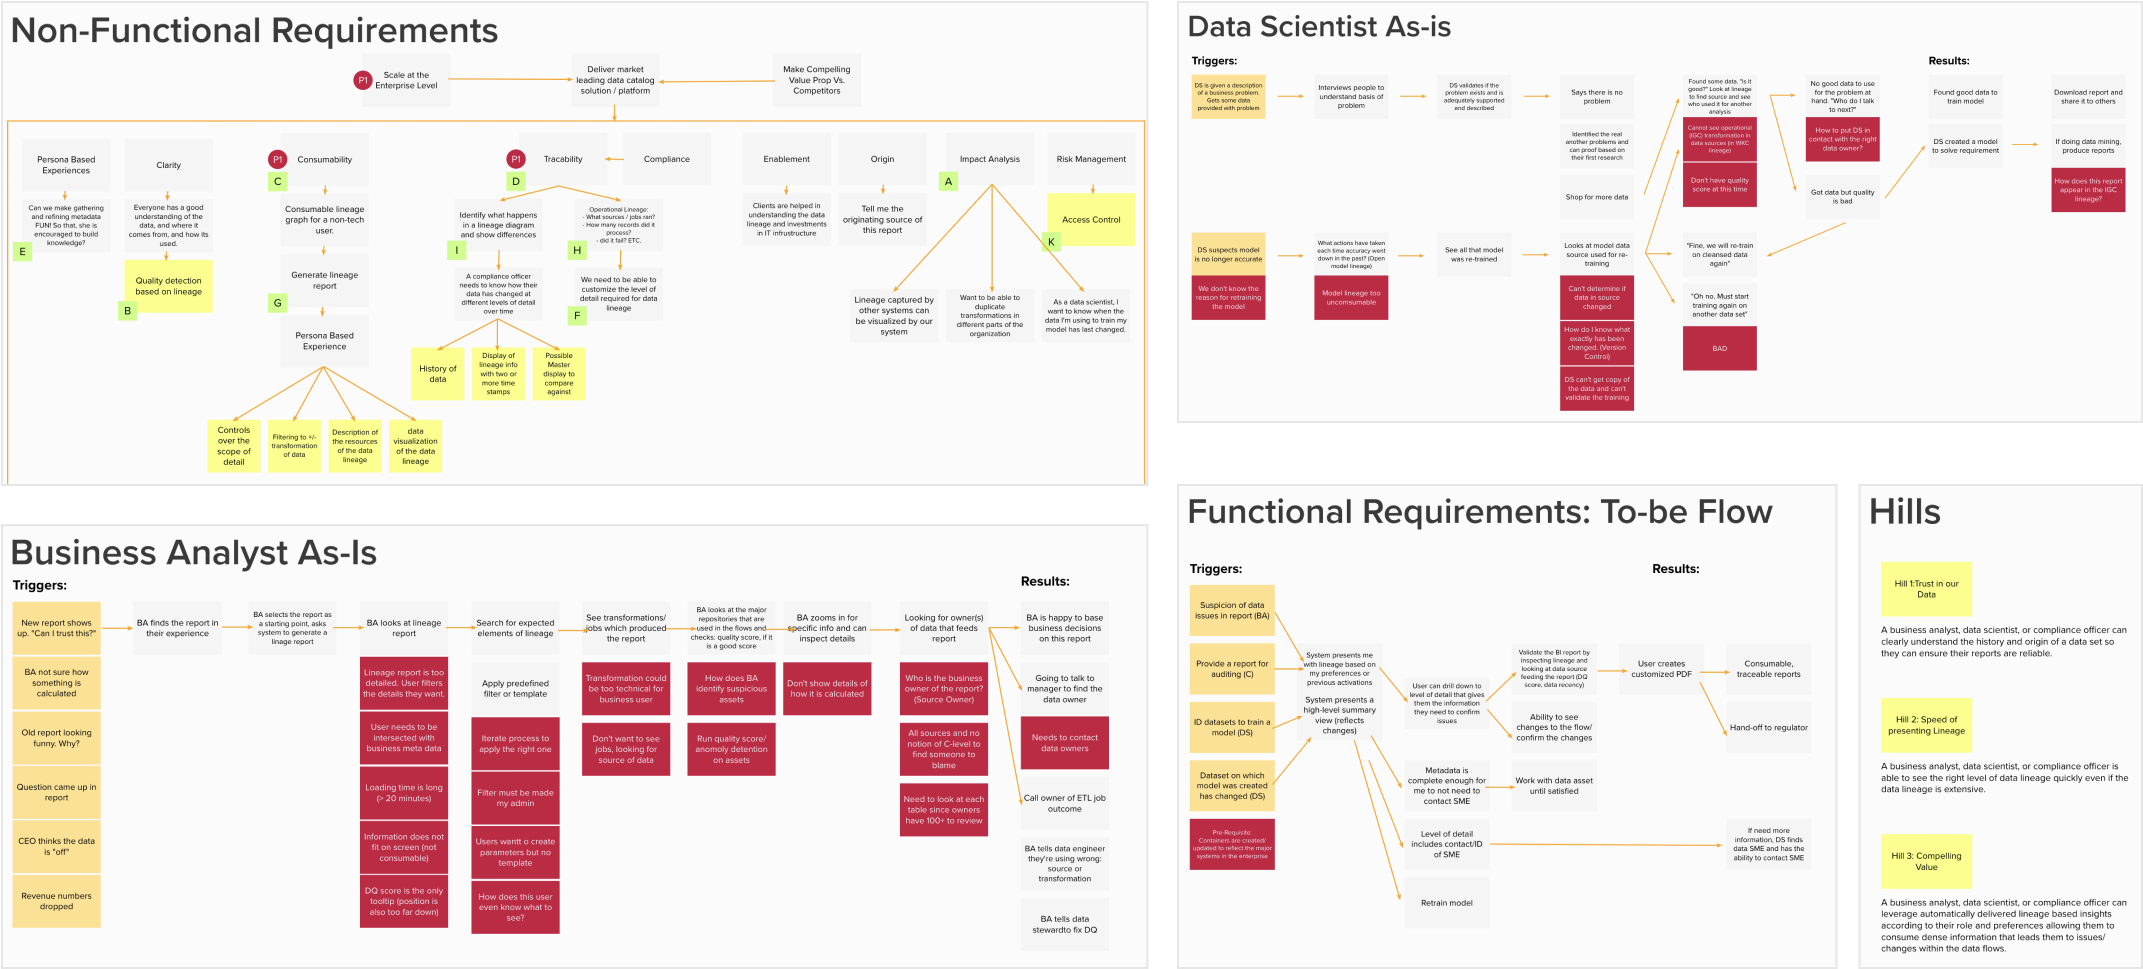
Validating key insights with user research
Collaborating with user research, we conducted a heuristic evaluation, competitive analysis, user feedback, and sponsor user testing to understand user pain points. We synthesized the research into key insights:
Flexible User Interface. Users preferred our competitor’s “modern” UI, which provided them more flexibility and control to change their lineage diagram.
Disruption in Workflow. The number of steps and pages it took to find the information they needed to complete their job.
Technical Information. Business analysts could not understand the technical data and needed a data scientist to decipher that information.
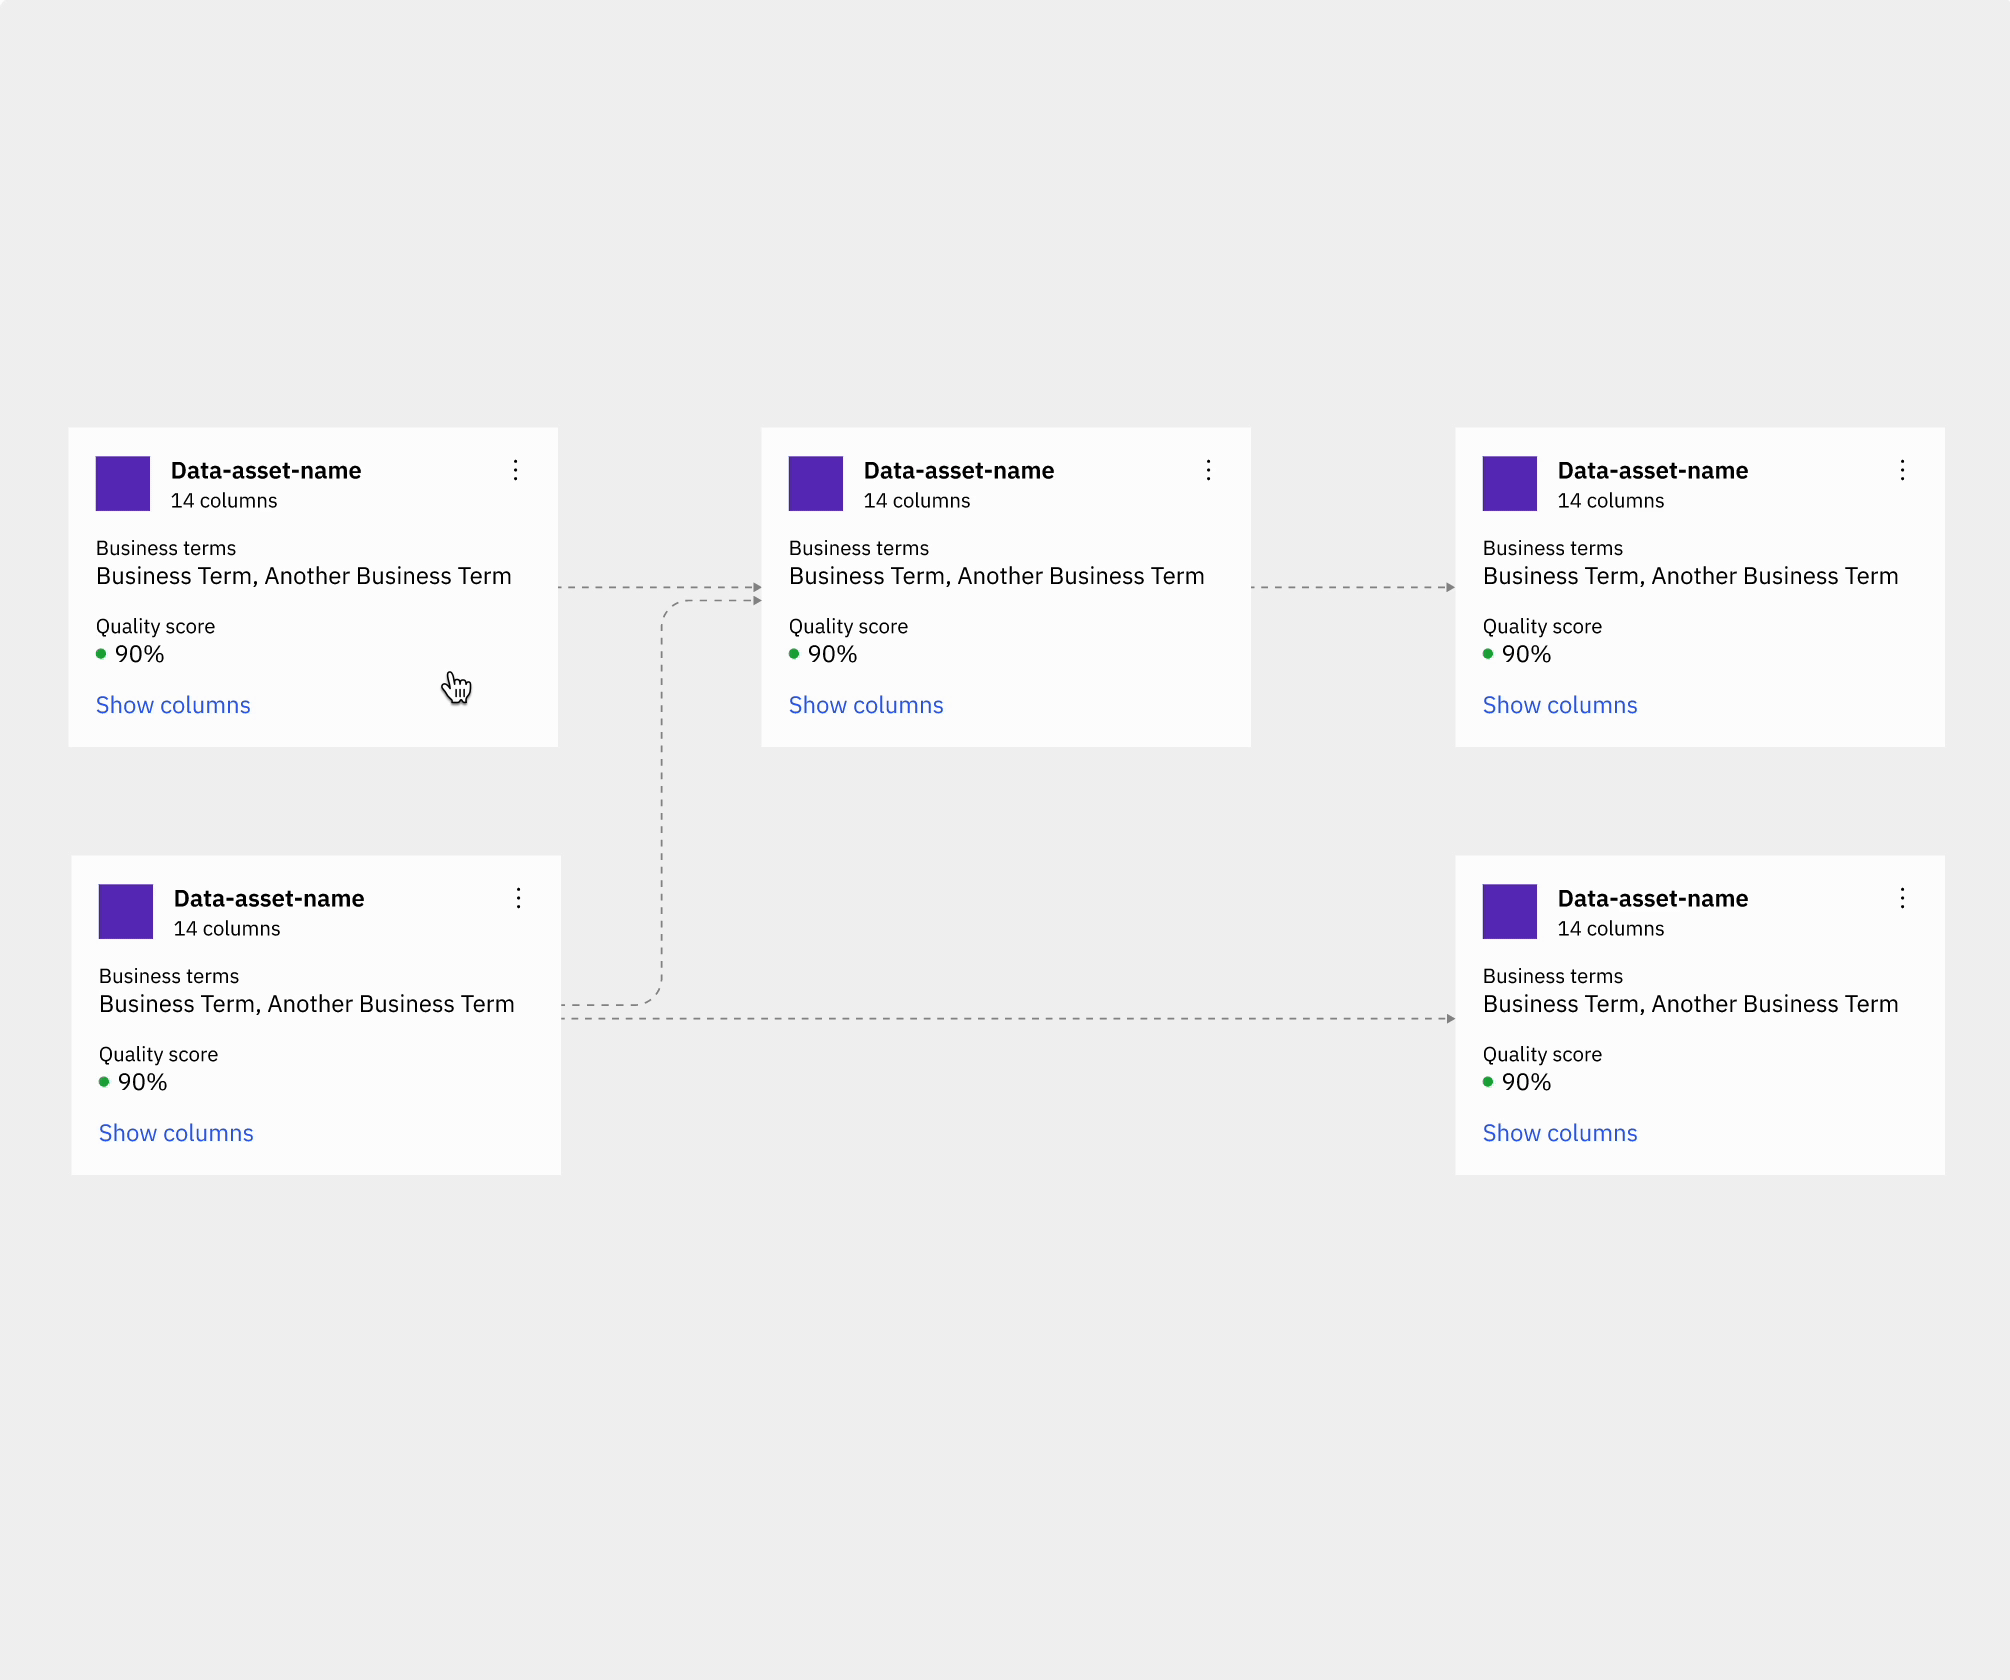
Summary View. Users do not care about all the information in the middle. They want to see their data origin and drill down to see more details.
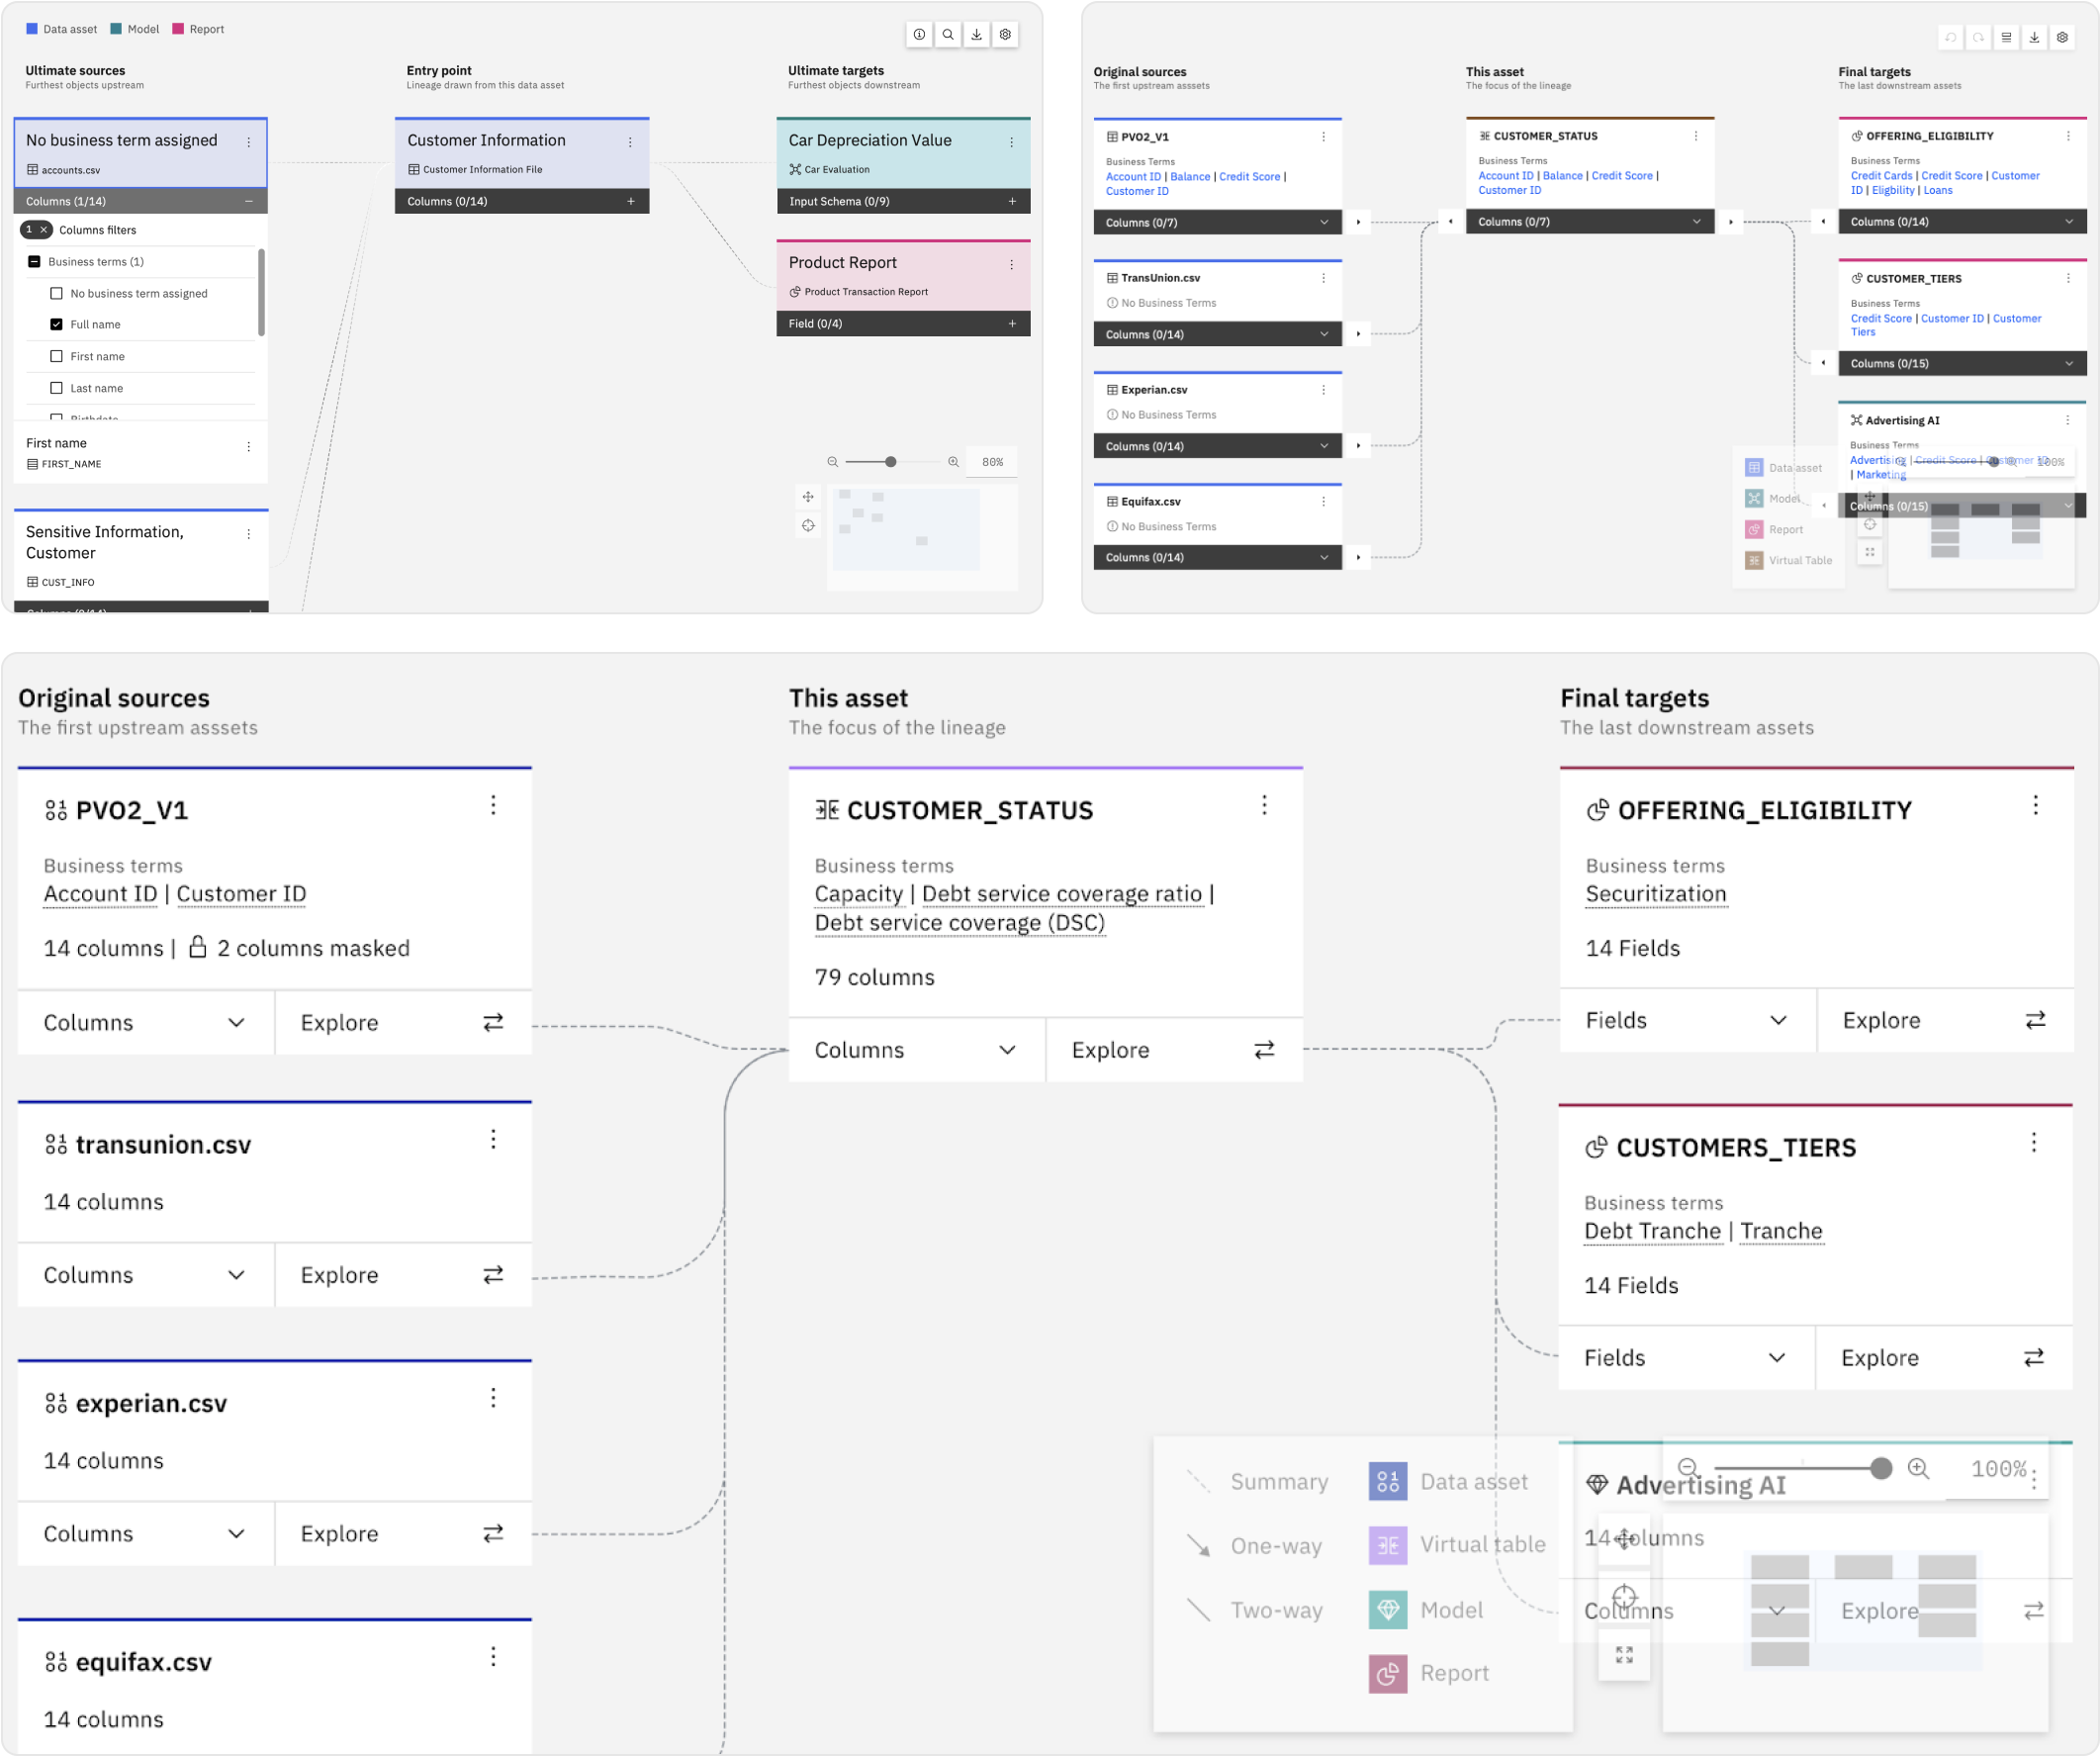
Design explorations for an optimal summary view
We focused on designing an optimal summary view because it achieved our product goals.
Scalable for larger diagrams because it took fewer seconds instead of hours due to fewer nodes being rendered.
Easily traceable. Can quickly identify your starting asset, where the data came from, and where it ultimately went.
Reduce cognitive overload. Fewer objects on the screen made it consumable to read.
Progressive disclosure enabled users to focus on a few things at a time and control the areas they want to see.

Node Explorations
Summary View Explorations
Experimenting and testing data visualization interactions
Data Lineage is a data visualization graph; testing interactions was essential to the user experience. The interactions I conducted usability testing on were:
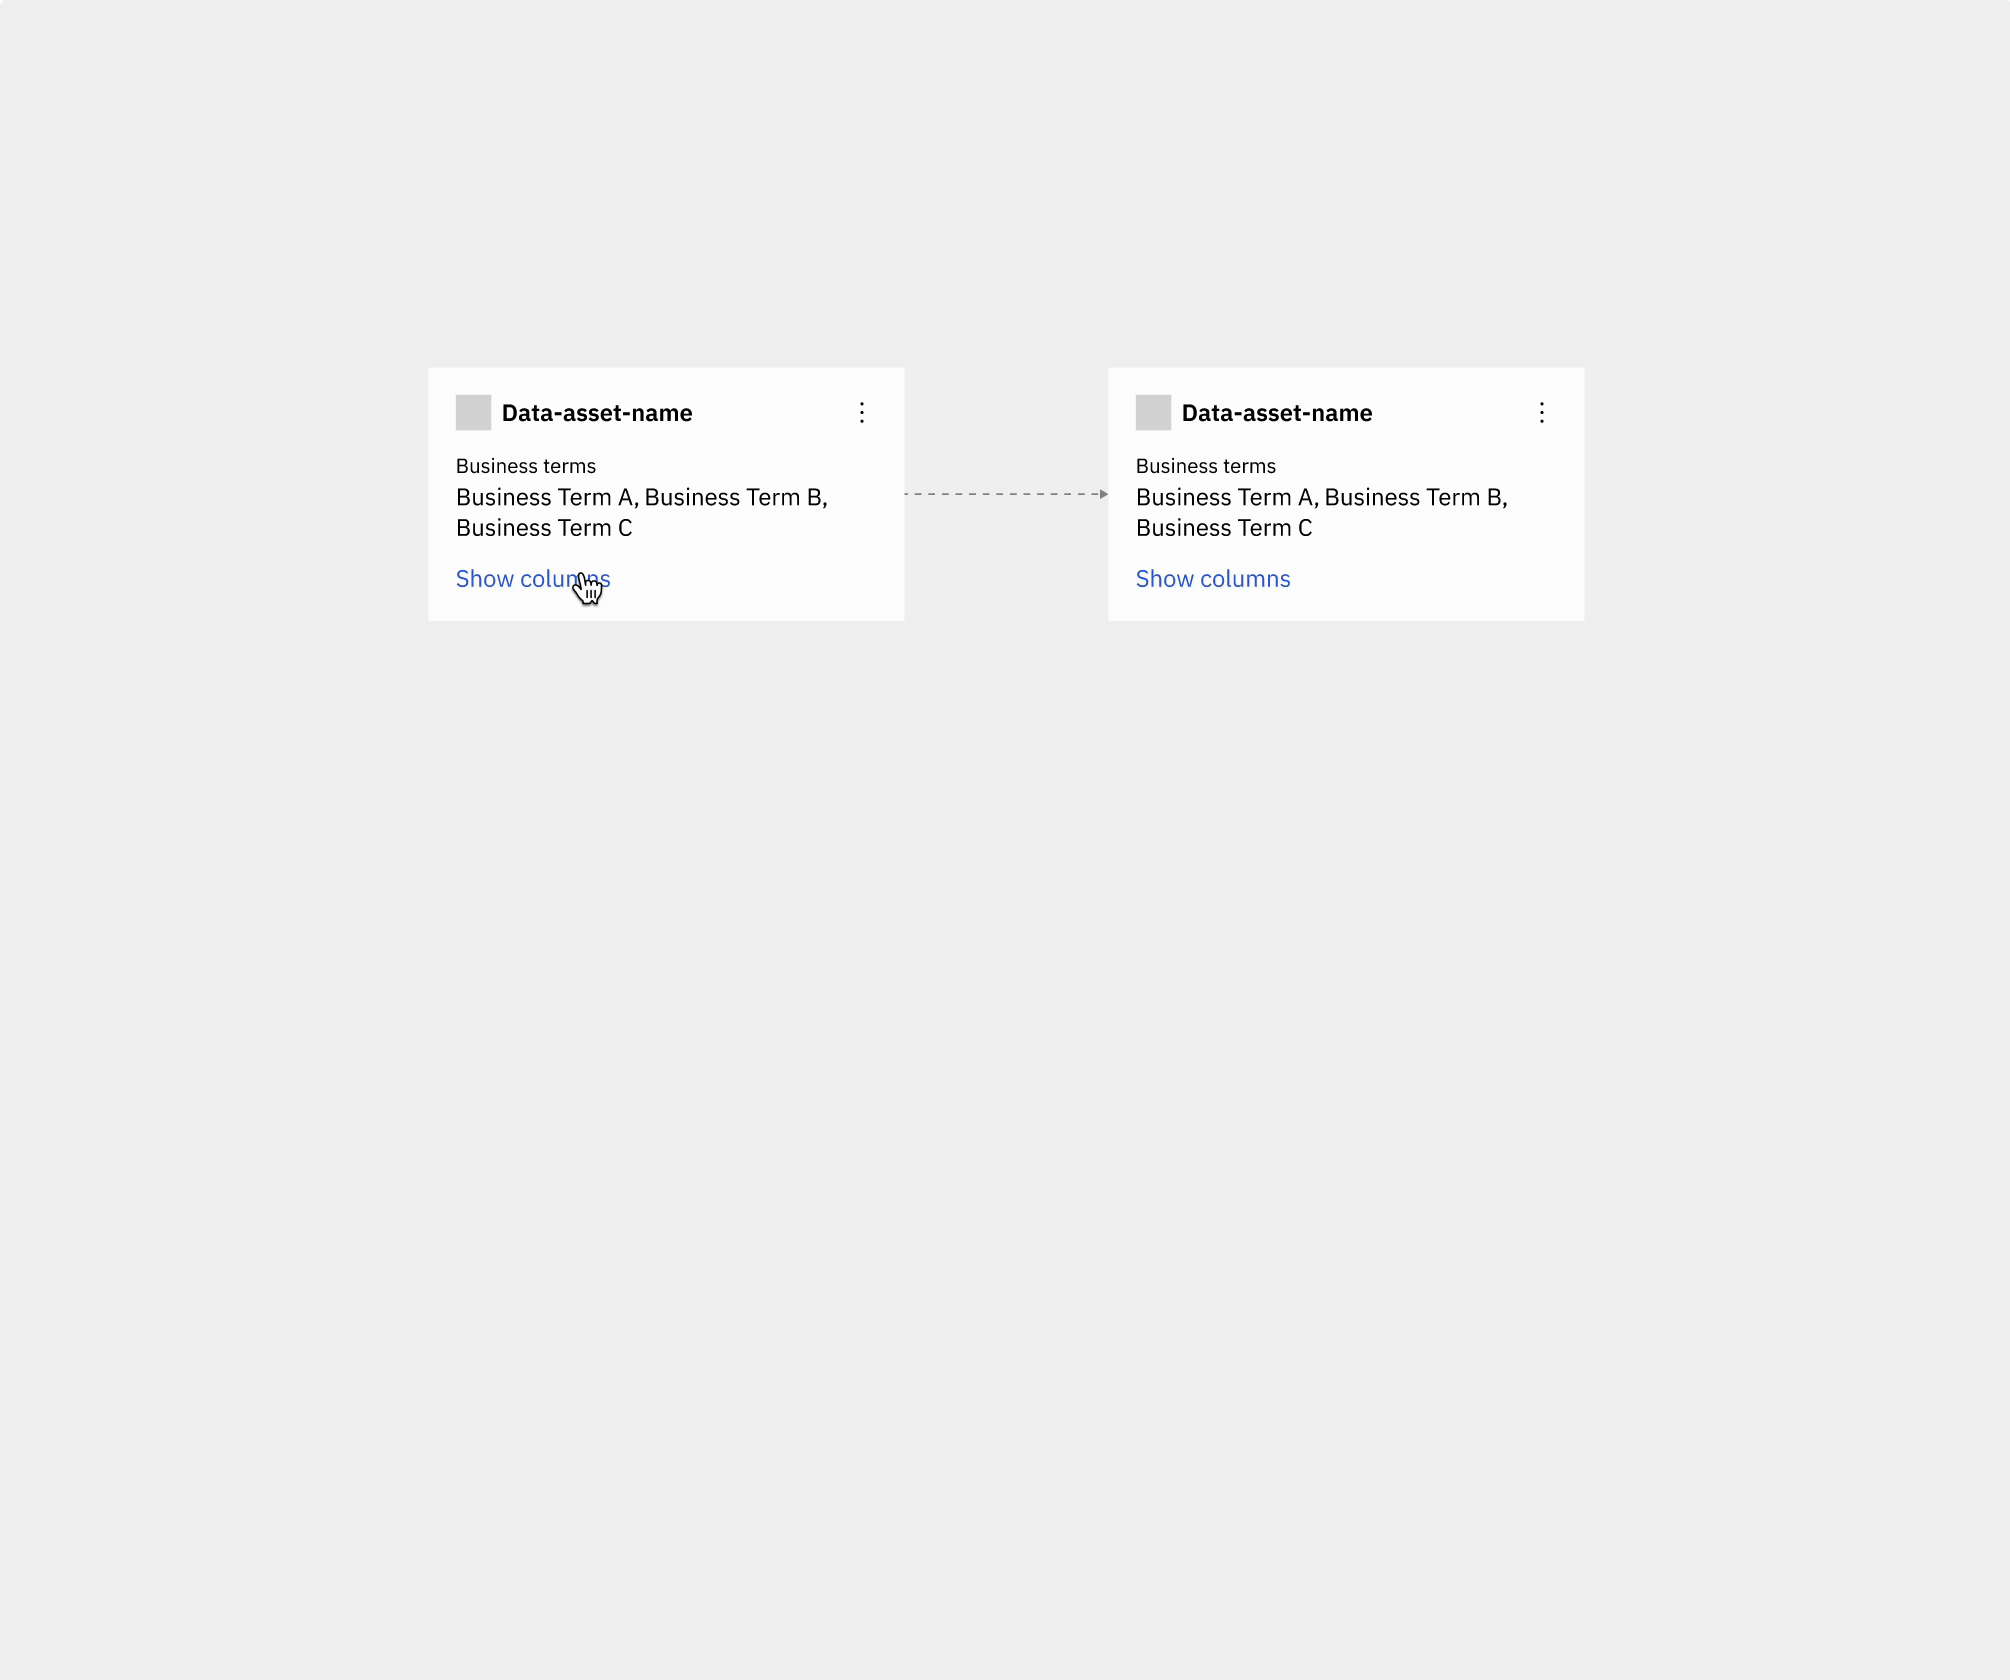
Adding Nodes. Testing users to see if they understand the Summary View and how to view more information.
Showing Columns. Testing users to see if they understand where to see the columns in a data set and if they know which columns they would be adding.
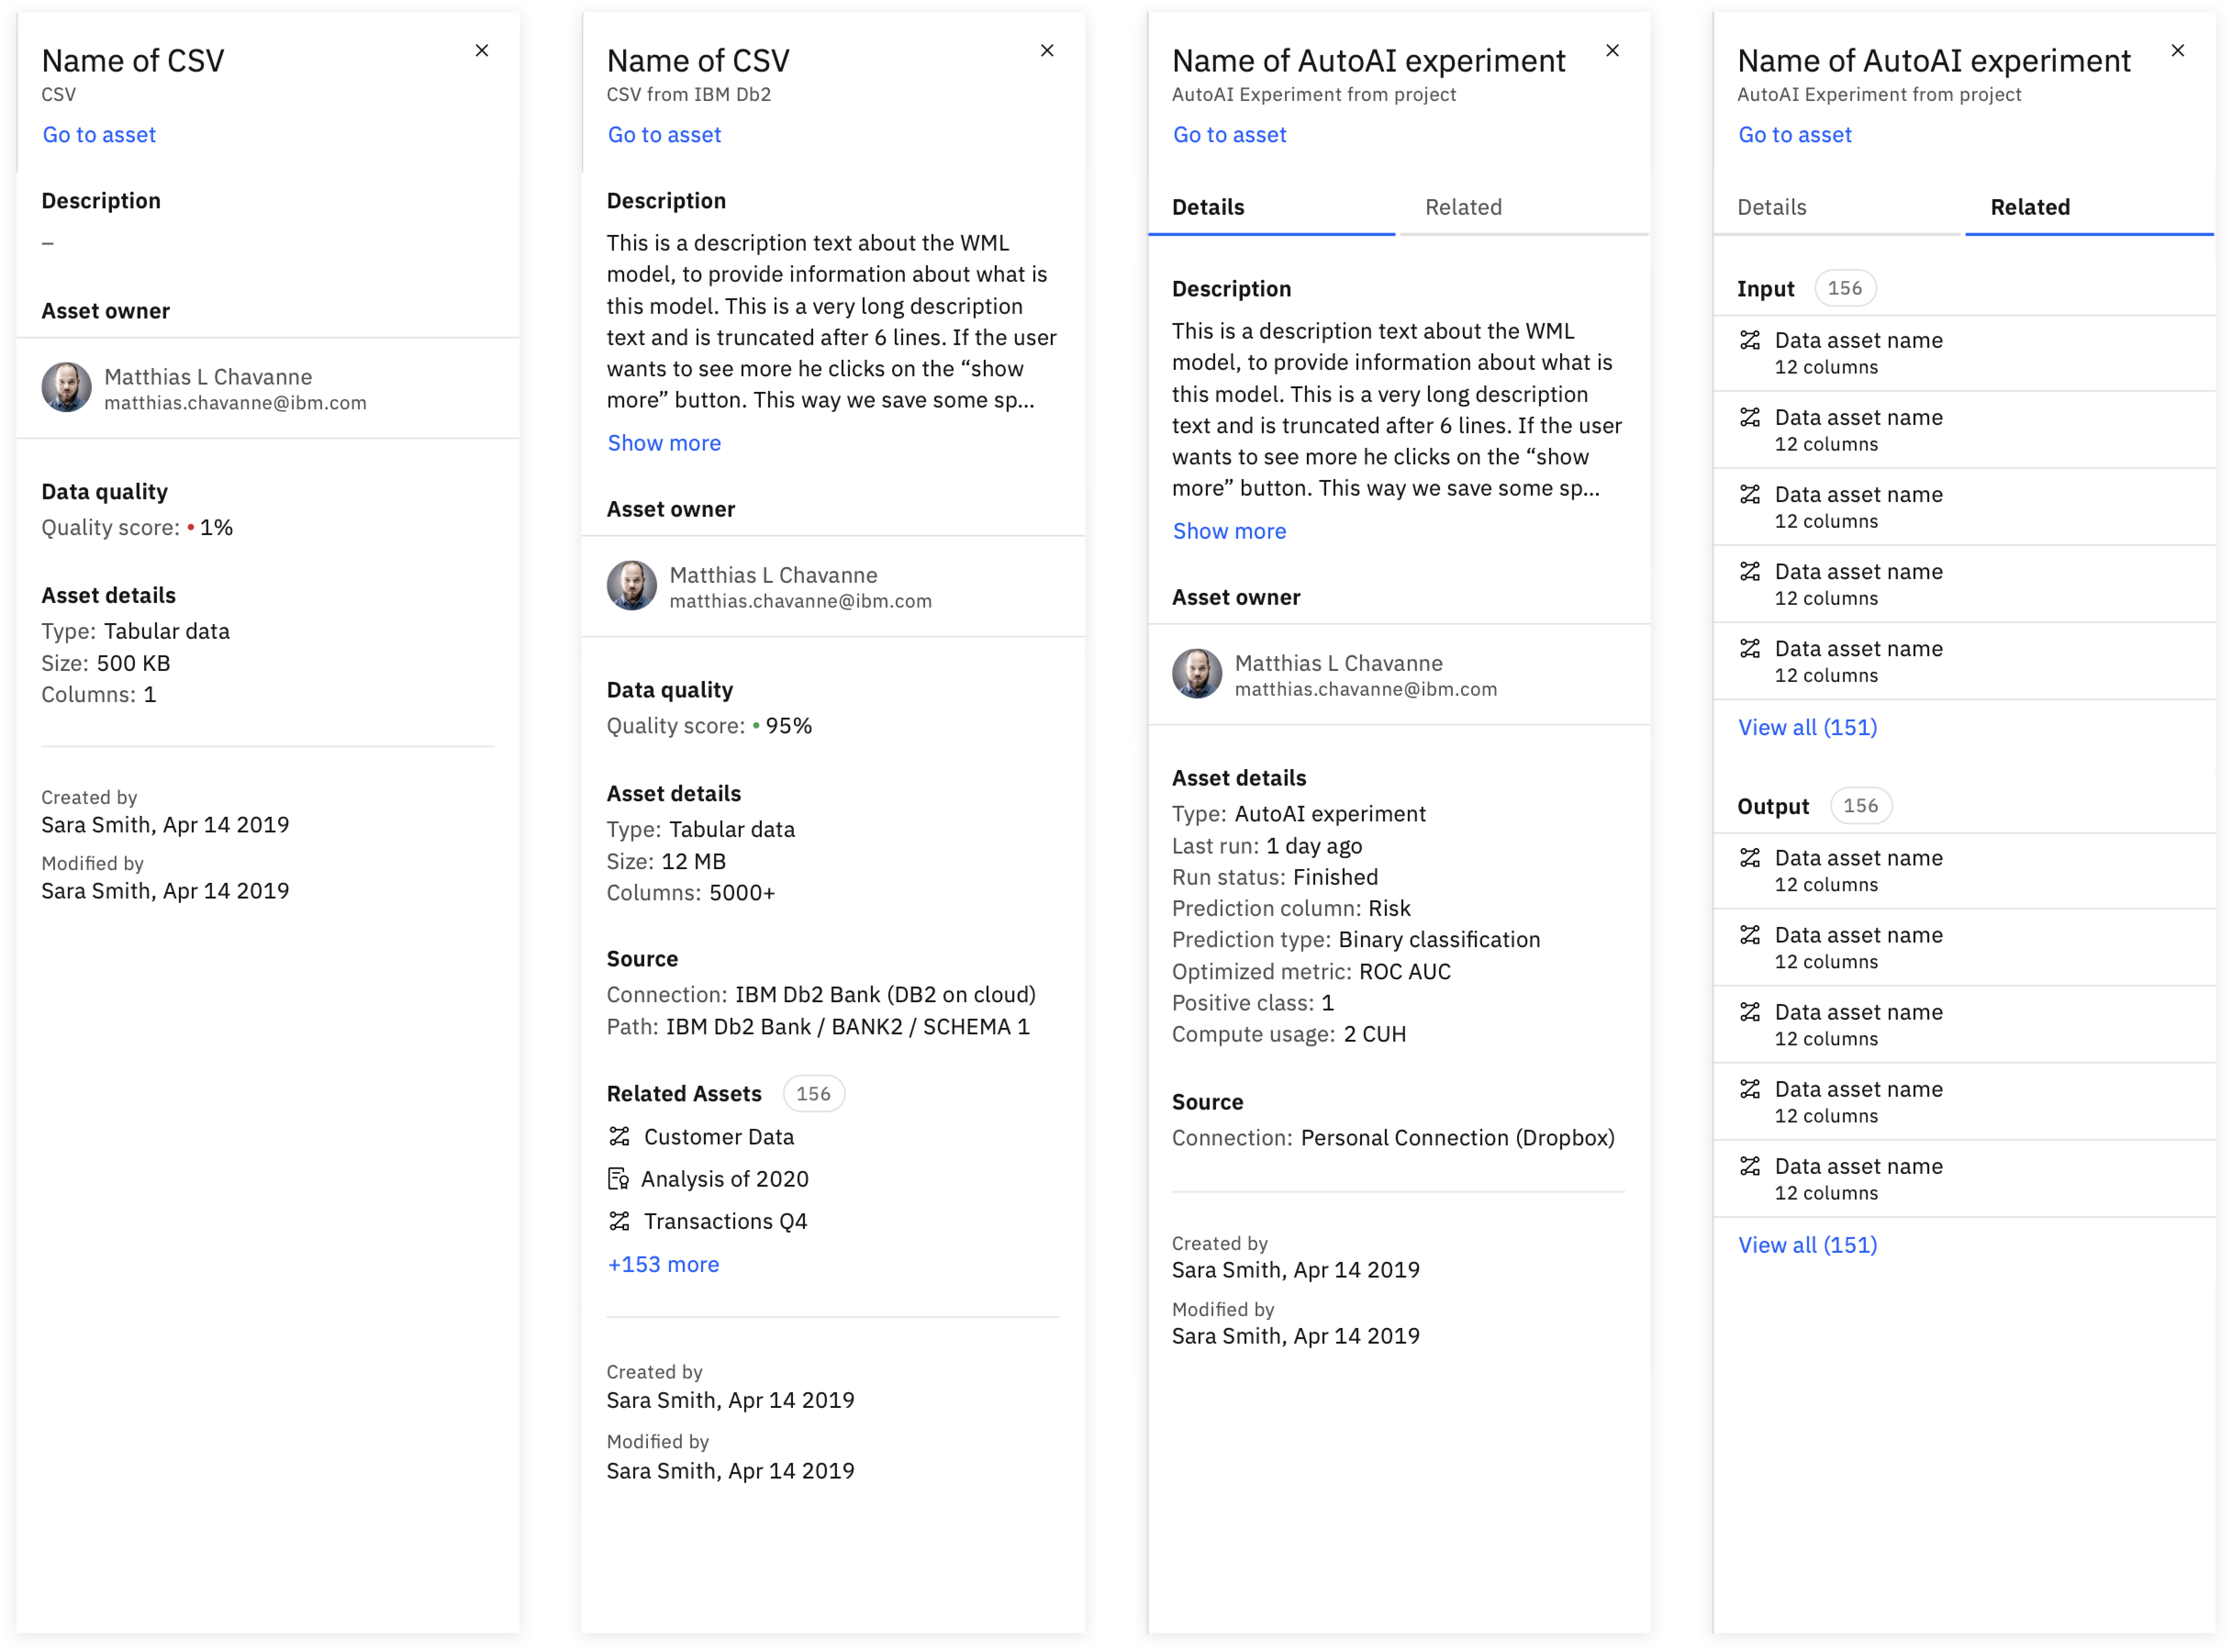
Selecting a Node. Interacting with the nodes on the screen to view more information without leaving the page.
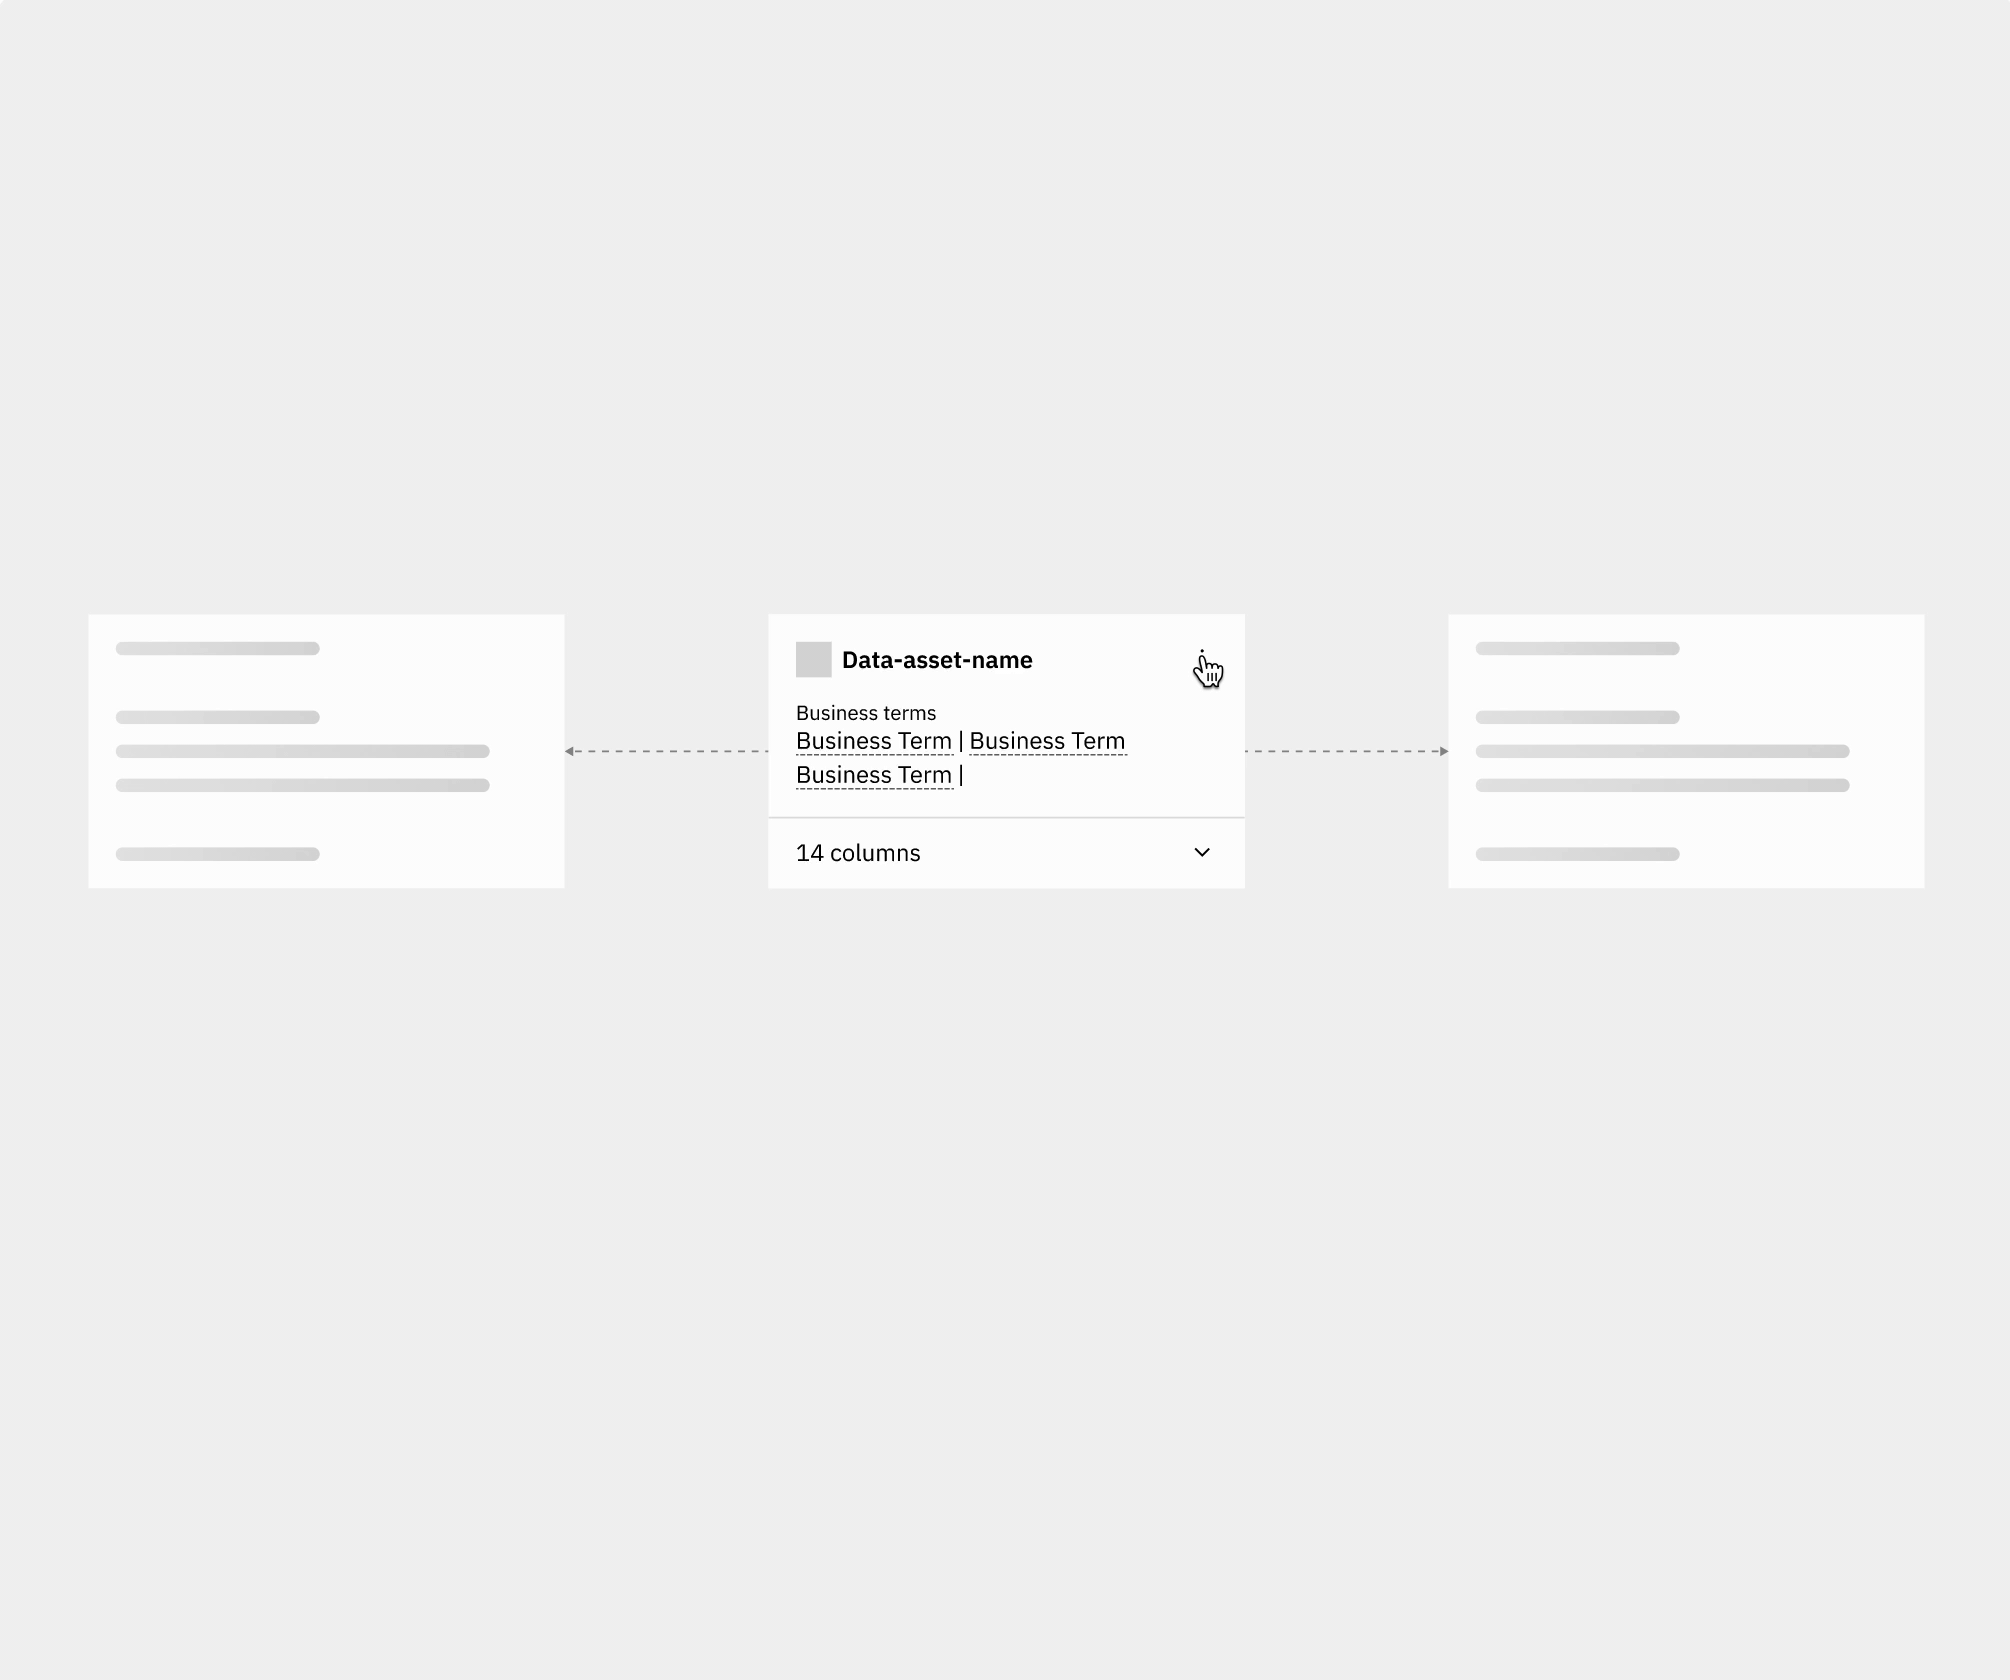
Adding Nodes
Adding Columns
Selecting a Node
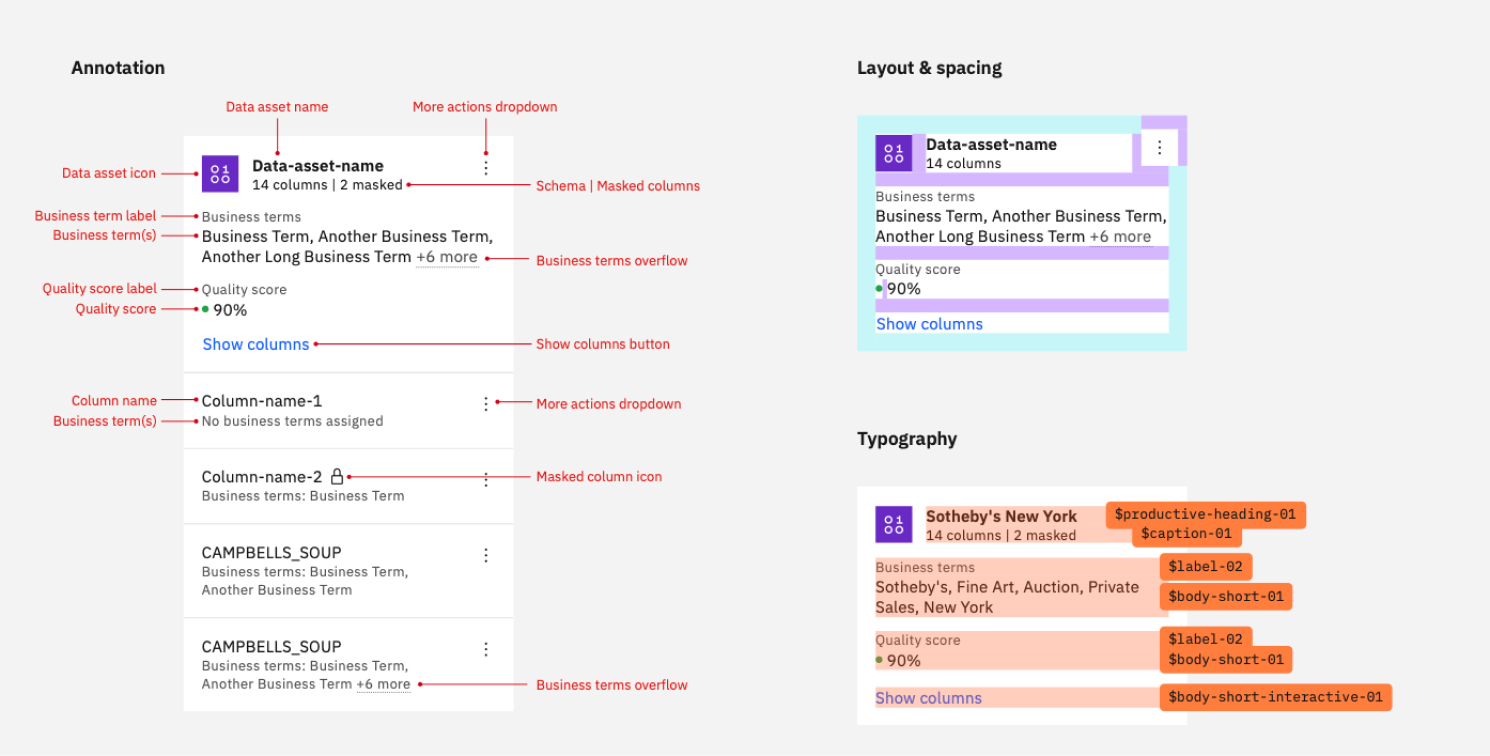
Ensuring design consistency throughout the platform
Design inconsistencies across IBM were affecting the overall user experience. I worked with several other product teams to identify and unify design inconsistencies across data visualization features and information panels.
The unification of design patterns led to an increase in design quality. I designed and developed a node component library where elements were contributed to the IBM Carbon Design System. The component library enabled designers and developers to prototype faster.
Impact & final designs
Reducing load time, improving visual designs, and optimizing workflows contributed to an increased NPS score and product recommendation for data governance products.
Watson Knowledge Catalog and Data Lineage have won several design awards, including a RedDot and an iF Design Award.
Data Lineage